Alaska Native vs Carpatho Rusyn Family Households with Children
COMPARE
Alaska Native
Carpatho Rusyn
Family Households with Children
Family Households with Children Comparison
Alaska Natives
Carpatho Rusyns
29.9%
FAMILY HOUSEHOLDS WITH CHILDREN
100.0/ 100
METRIC RATING
19th/ 347
METRIC RANK
25.2%
FAMILY HOUSEHOLDS WITH CHILDREN
0.0/ 100
METRIC RATING
346th/ 347
METRIC RANK
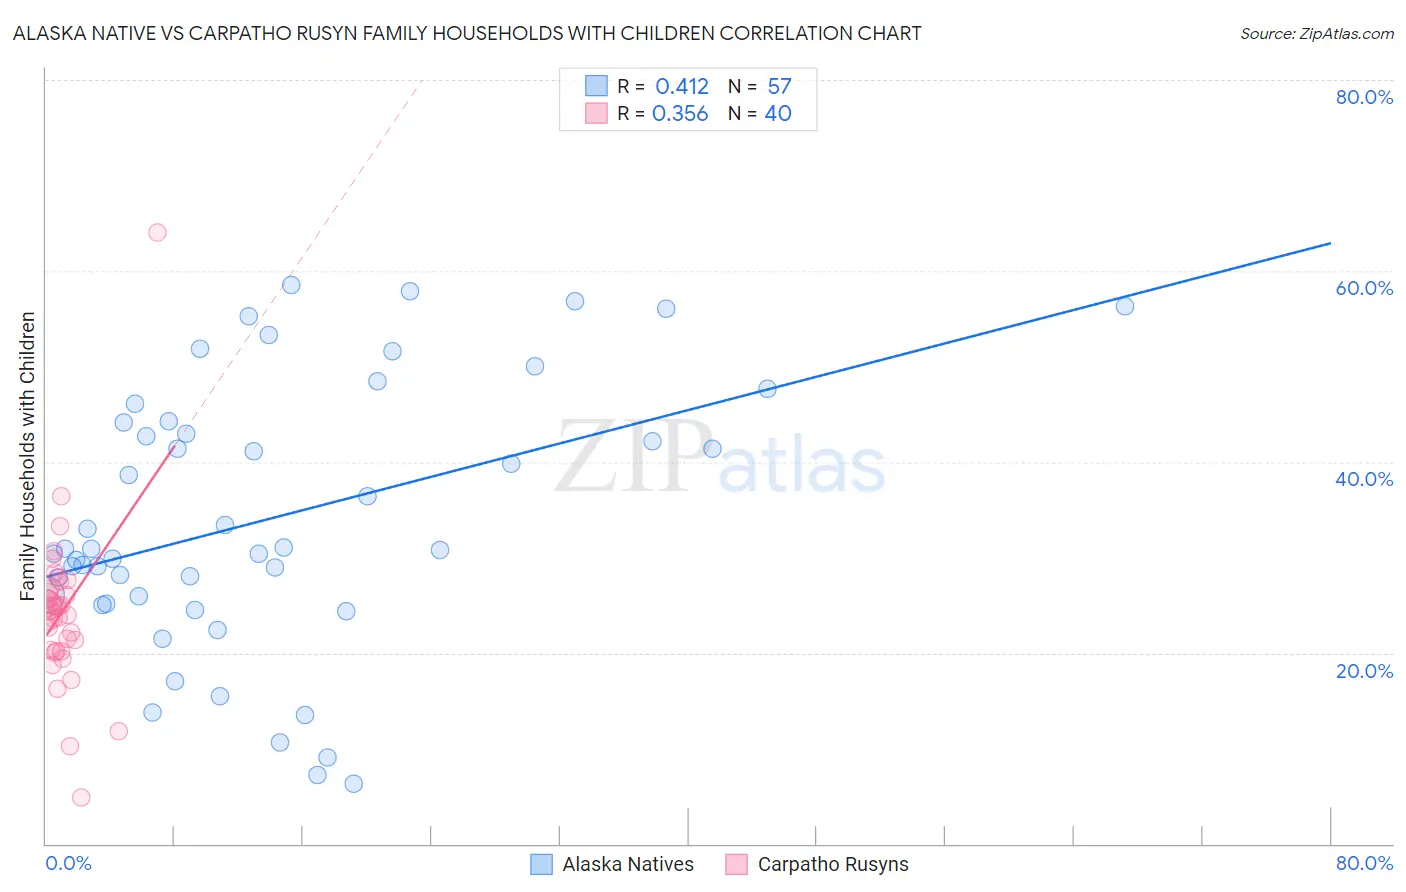
Alaska Native vs Carpatho Rusyn Family Households with Children Correlation Chart
The statistical analysis conducted on geographies consisting of 76,746,516 people shows a moderate positive correlation between the proportion of Alaska Natives and percentage of family households with children in the United States with a correlation coefficient (R) of 0.412 and weighted average of 29.9%. Similarly, the statistical analysis conducted on geographies consisting of 58,871,401 people shows a mild positive correlation between the proportion of Carpatho Rusyns and percentage of family households with children in the United States with a correlation coefficient (R) of 0.356 and weighted average of 25.2%, a difference of 18.6%.
Family Households with Children Correlation Summary
| Measurement | Alaska Native | Carpatho Rusyn |
| Minimum | 6.2% | 4.8% |
| Maximum | 58.5% | 64.0% |
| Range | 52.2% | 59.2% |
| Mean | 34.1% | 24.3% |
| Median | 30.9% | 24.6% |
| Interquartile 25% (IQ1) | 25.5% | 20.2% |
| Interquartile 75% (IQ3) | 44.2% | 26.6% |
| Interquartile Range (IQR) | 18.7% | 6.3% |
| Standard Deviation (Sample) | 13.9% | 8.7% |
| Standard Deviation (Population) | 13.7% | 8.6% |
Similar Demographics by Family Households with Children
Demographics Similar to Alaska Natives by Family Households with Children
In terms of family households with children, the demographic groups most similar to Alaska Natives are Immigrants from El Salvador (29.8%, a difference of 0.030%), Salvadoran (29.9%, a difference of 0.040%), Immigrants from Laos (29.8%, a difference of 0.070%), Malaysian (29.8%, a difference of 0.11%), and Hispanic or Latino (29.9%, a difference of 0.22%).
| Demographics | Rating | Rank | Family Households with Children |
| Immigrants | Pakistan | 100.0 /100 | #12 | Exceptional 30.2% |
| Afghans | 100.0 /100 | #13 | Exceptional 30.2% |
| Bangladeshis | 100.0 /100 | #14 | Exceptional 30.1% |
| Immigrants | South Central Asia | 100.0 /100 | #15 | Exceptional 30.0% |
| Immigrants | Afghanistan | 100.0 /100 | #16 | Exceptional 30.0% |
| Hispanics or Latinos | 100.0 /100 | #17 | Exceptional 29.9% |
| Salvadorans | 100.0 /100 | #18 | Exceptional 29.9% |
| Alaska Natives | 100.0 /100 | #19 | Exceptional 29.9% |
| Immigrants | El Salvador | 100.0 /100 | #20 | Exceptional 29.8% |
| Immigrants | Laos | 100.0 /100 | #21 | Exceptional 29.8% |
| Malaysians | 100.0 /100 | #22 | Exceptional 29.8% |
| Mexican American Indians | 100.0 /100 | #23 | Exceptional 29.7% |
| Guamanians/Chamorros | 100.0 /100 | #24 | Exceptional 29.7% |
| Immigrants | Latin America | 100.0 /100 | #25 | Exceptional 29.7% |
| Sri Lankans | 100.0 /100 | #26 | Exceptional 29.5% |
Demographics Similar to Carpatho Rusyns by Family Households with Children
In terms of family households with children, the demographic groups most similar to Carpatho Rusyns are Immigrants from Grenada (25.2%, a difference of 0.0%), Pueblo (25.2%, a difference of 0.18%), Hopi (25.2%, a difference of 0.29%), Alsatian (25.3%, a difference of 0.44%), and Immigrants from Serbia (25.5%, a difference of 1.1%).
| Demographics | Rating | Rank | Family Households with Children |
| Immigrants | Switzerland | 0.0 /100 | #333 | Tragic 25.7% |
| Slovaks | 0.0 /100 | #334 | Tragic 25.7% |
| Immigrants | Croatia | 0.0 /100 | #335 | Tragic 25.7% |
| Immigrants | West Indies | 0.0 /100 | #336 | Tragic 25.7% |
| Puerto Ricans | 0.0 /100 | #337 | Tragic 25.6% |
| Arapaho | 0.0 /100 | #338 | Tragic 25.6% |
| Immigrants | St. Vincent and the Grenadines | 0.0 /100 | #339 | Tragic 25.6% |
| Immigrants | Armenia | 0.0 /100 | #340 | Tragic 25.6% |
| Immigrants | Serbia | 0.0 /100 | #341 | Tragic 25.5% |
| Alsatians | 0.0 /100 | #342 | Tragic 25.3% |
| Hopi | 0.0 /100 | #343 | Tragic 25.2% |
| Pueblo | 0.0 /100 | #344 | Tragic 25.2% |
| Immigrants | Grenada | 0.0 /100 | #345 | Tragic 25.2% |
| Carpatho Rusyns | 0.0 /100 | #346 | Tragic 25.2% |
| Soviet Union | 0.0 /100 | #347 | Tragic 24.8% |