Immigrants from Western Asia vs Carpatho Rusyn Family Households with Children
COMPARE
Immigrants from Western Asia
Carpatho Rusyn
Family Households with Children
Family Households with Children Comparison
Immigrants from Western Asia
Carpatho Rusyns
27.9%
FAMILY HOUSEHOLDS WITH CHILDREN
93.6/ 100
METRIC RATING
121st/ 347
METRIC RANK
25.2%
FAMILY HOUSEHOLDS WITH CHILDREN
0.0/ 100
METRIC RATING
346th/ 347
METRIC RANK
Immigrants from Western Asia vs Carpatho Rusyn Family Households with Children Correlation Chart
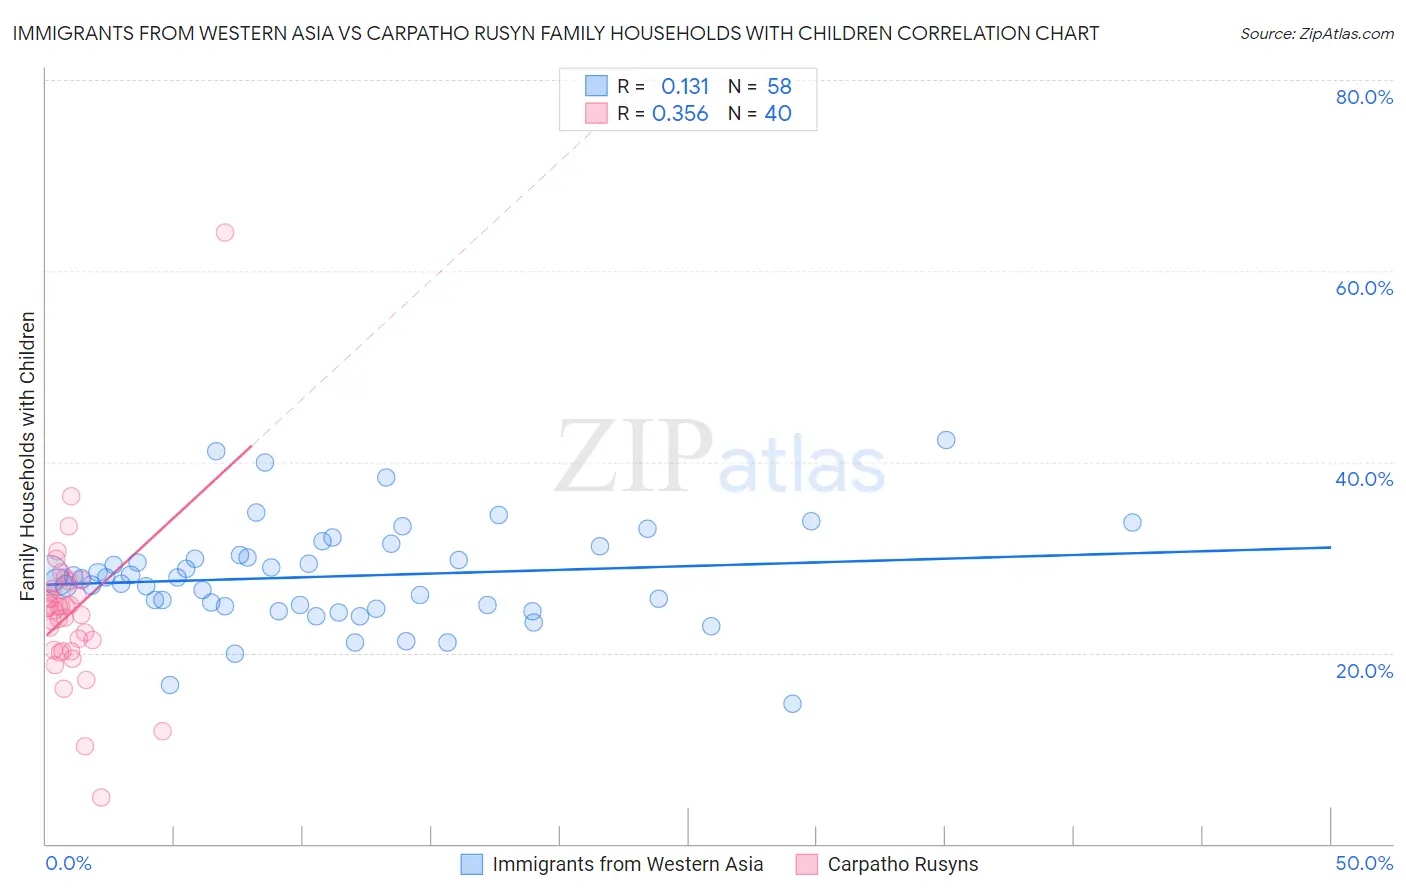
The statistical analysis conducted on geographies consisting of 404,015,285 people shows a poor positive correlation between the proportion of Immigrants from Western Asia and percentage of family households with children in the United States with a correlation coefficient (R) of 0.131 and weighted average of 27.9%. Similarly, the statistical analysis conducted on geographies consisting of 58,871,401 people shows a mild positive correlation between the proportion of Carpatho Rusyns and percentage of family households with children in the United States with a correlation coefficient (R) of 0.356 and weighted average of 25.2%, a difference of 10.6%.
Family Households with Children Correlation Summary
| Measurement | Immigrants from Western Asia | Carpatho Rusyn |
| Minimum | 14.6% | 4.8% |
| Maximum | 42.3% | 64.0% |
| Range | 27.6% | 59.2% |
| Mean | 28.0% | 24.3% |
| Median | 27.8% | 24.6% |
| Interquartile 25% (IQ1) | 24.9% | 20.2% |
| Interquartile 75% (IQ3) | 30.3% | 26.6% |
| Interquartile Range (IQR) | 5.4% | 6.3% |
| Standard Deviation (Sample) | 5.3% | 8.7% |
| Standard Deviation (Population) | 5.3% | 8.6% |
Similar Demographics by Family Households with Children
Demographics Similar to Immigrants from Western Asia by Family Households with Children
In terms of family households with children, the demographic groups most similar to Immigrants from Western Asia are Immigrants from Zimbabwe (27.8%, a difference of 0.070%), Immigrants from Northern Africa (27.8%, a difference of 0.14%), European (27.9%, a difference of 0.19%), Immigrants from Singapore (27.8%, a difference of 0.21%), and Ecuadorian (27.8%, a difference of 0.21%).
| Demographics | Rating | Rank | Family Households with Children |
| South American Indians | 96.9 /100 | #114 | Exceptional 28.0% |
| Immigrants | Africa | 96.8 /100 | #115 | Exceptional 28.0% |
| Pakistanis | 96.0 /100 | #116 | Exceptional 27.9% |
| Immigrants | Malaysia | 95.9 /100 | #117 | Exceptional 27.9% |
| Central American Indians | 95.9 /100 | #118 | Exceptional 27.9% |
| Zimbabweans | 95.6 /100 | #119 | Exceptional 27.9% |
| Europeans | 95.4 /100 | #120 | Exceptional 27.9% |
| Immigrants | Western Asia | 93.6 /100 | #121 | Exceptional 27.9% |
| Immigrants | Zimbabwe | 92.8 /100 | #122 | Exceptional 27.8% |
| Immigrants | Northern Africa | 91.8 /100 | #123 | Exceptional 27.8% |
| Immigrants | Singapore | 90.8 /100 | #124 | Exceptional 27.8% |
| Ecuadorians | 90.8 /100 | #125 | Exceptional 27.8% |
| Immigrants | Ethiopia | 90.5 /100 | #126 | Exceptional 27.8% |
| Belizeans | 90.0 /100 | #127 | Exceptional 27.8% |
| Syrians | 89.7 /100 | #128 | Excellent 27.8% |
Demographics Similar to Carpatho Rusyns by Family Households with Children
In terms of family households with children, the demographic groups most similar to Carpatho Rusyns are Immigrants from Grenada (25.2%, a difference of 0.0%), Pueblo (25.2%, a difference of 0.18%), Hopi (25.2%, a difference of 0.29%), Alsatian (25.3%, a difference of 0.44%), and Immigrants from Serbia (25.5%, a difference of 1.1%).
| Demographics | Rating | Rank | Family Households with Children |
| Immigrants | Switzerland | 0.0 /100 | #333 | Tragic 25.7% |
| Slovaks | 0.0 /100 | #334 | Tragic 25.7% |
| Immigrants | Croatia | 0.0 /100 | #335 | Tragic 25.7% |
| Immigrants | West Indies | 0.0 /100 | #336 | Tragic 25.7% |
| Puerto Ricans | 0.0 /100 | #337 | Tragic 25.6% |
| Arapaho | 0.0 /100 | #338 | Tragic 25.6% |
| Immigrants | St. Vincent and the Grenadines | 0.0 /100 | #339 | Tragic 25.6% |
| Immigrants | Armenia | 0.0 /100 | #340 | Tragic 25.6% |
| Immigrants | Serbia | 0.0 /100 | #341 | Tragic 25.5% |
| Alsatians | 0.0 /100 | #342 | Tragic 25.3% |
| Hopi | 0.0 /100 | #343 | Tragic 25.2% |
| Pueblo | 0.0 /100 | #344 | Tragic 25.2% |
| Immigrants | Grenada | 0.0 /100 | #345 | Tragic 25.2% |
| Carpatho Rusyns | 0.0 /100 | #346 | Tragic 25.2% |
| Soviet Union | 0.0 /100 | #347 | Tragic 24.8% |