Welsh vs Pennsylvania German Family Households with Children
COMPARE
Welsh
Pennsylvania German
Family Households with Children
Family Households with Children Comparison
Welsh
Pennsylvania Germans
27.2%
FAMILY HOUSEHOLDS WITH CHILDREN
14.2/ 100
METRIC RATING
211th/ 347
METRIC RANK
27.4%
FAMILY HOUSEHOLDS WITH CHILDREN
37.5/ 100
METRIC RATING
192nd/ 347
METRIC RANK
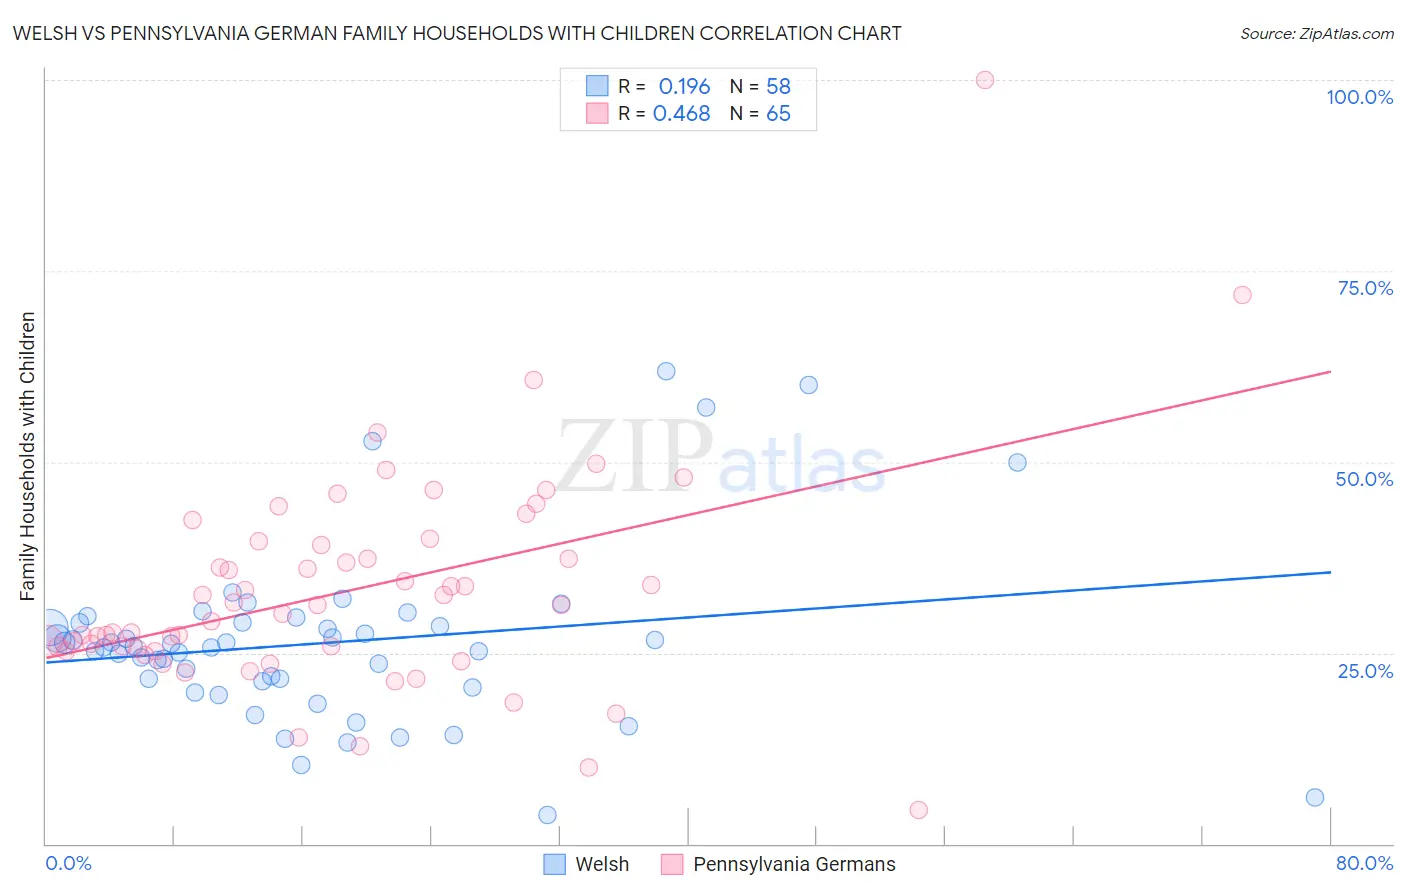
Welsh vs Pennsylvania German Family Households with Children Correlation Chart
The statistical analysis conducted on geographies consisting of 527,895,960 people shows a poor positive correlation between the proportion of Welsh and percentage of family households with children in the United States with a correlation coefficient (R) of 0.196 and weighted average of 27.2%. Similarly, the statistical analysis conducted on geographies consisting of 233,961,209 people shows a moderate positive correlation between the proportion of Pennsylvania Germans and percentage of family households with children in the United States with a correlation coefficient (R) of 0.468 and weighted average of 27.4%, a difference of 0.72%.
Family Households with Children Correlation Summary
| Measurement | Welsh | Pennsylvania German |
| Minimum | 3.8% | 4.3% |
| Maximum | 61.8% | 100.0% |
| Range | 58.0% | 95.7% |
| Mean | 26.3% | 33.2% |
| Median | 25.8% | 31.2% |
| Interquartile 25% (IQ1) | 21.2% | 25.4% |
| Interquartile 75% (IQ3) | 28.9% | 39.4% |
| Interquartile Range (IQR) | 7.7% | 14.0% |
| Standard Deviation (Sample) | 11.3% | 14.4% |
| Standard Deviation (Population) | 11.2% | 14.3% |
Demographics Similar to Welsh and Pennsylvania Germans by Family Households with Children
In terms of family households with children, the demographic groups most similar to Welsh are Immigrants from Ukraine (27.2%, a difference of 0.010%), Dutch West Indian (27.2%, a difference of 0.070%), Immigrants from Poland (27.2%, a difference of 0.10%), Haitian (27.2%, a difference of 0.22%), and Immigrants from Haiti (27.2%, a difference of 0.24%). Similarly, the demographic groups most similar to Pennsylvania Germans are Sudanese (27.4%, a difference of 0.0%), Swedish (27.4%, a difference of 0.020%), Immigrants from Iran (27.4%, a difference of 0.030%), Crow (27.4%, a difference of 0.040%), and Cheyenne (27.4%, a difference of 0.060%).
| Demographics | Rating | Rank | Family Households with Children |
| Sudanese | 37.6 /100 | #191 | Fair 27.4% |
| Pennsylvania Germans | 37.5 /100 | #192 | Fair 27.4% |
| Swedes | 36.9 /100 | #193 | Fair 27.4% |
| Immigrants | Iran | 36.1 /100 | #194 | Fair 27.4% |
| Crow | 35.7 /100 | #195 | Fair 27.4% |
| Cheyenne | 35.1 /100 | #196 | Fair 27.4% |
| Norwegians | 35.0 /100 | #197 | Fair 27.4% |
| Immigrants | Romania | 34.4 /100 | #198 | Fair 27.4% |
| English | 32.0 /100 | #199 | Fair 27.3% |
| Immigrants | Congo | 28.7 /100 | #200 | Fair 27.3% |
| Bhutanese | 25.1 /100 | #201 | Fair 27.3% |
| Americans | 22.8 /100 | #202 | Fair 27.3% |
| Kiowa | 22.2 /100 | #203 | Fair 27.3% |
| Immigrants | Sudan | 21.6 /100 | #204 | Fair 27.3% |
| Immigrants | Haiti | 20.3 /100 | #205 | Fair 27.2% |
| Immigrants | Micronesia | 20.2 /100 | #206 | Fair 27.2% |
| Haitians | 19.8 /100 | #207 | Poor 27.2% |
| Immigrants | Poland | 16.4 /100 | #208 | Poor 27.2% |
| Dutch West Indians | 15.8 /100 | #209 | Poor 27.2% |
| Immigrants | Ukraine | 14.4 /100 | #210 | Poor 27.2% |
| Welsh | 14.2 /100 | #211 | Poor 27.2% |