Venezuelan vs Spanish American Indian Single Mother Households
COMPARE
Venezuelan
Spanish American Indian
Single Mother Households
Single Mother Households Comparison
Venezuelans
Spanish American Indians
6.6%
SINGLE MOTHER HOUSEHOLDS
12.9/ 100
METRIC RATING
201st/ 347
METRIC RANK
7.3%
SINGLE MOTHER HOUSEHOLDS
0.4/ 100
METRIC RATING
248th/ 347
METRIC RANK
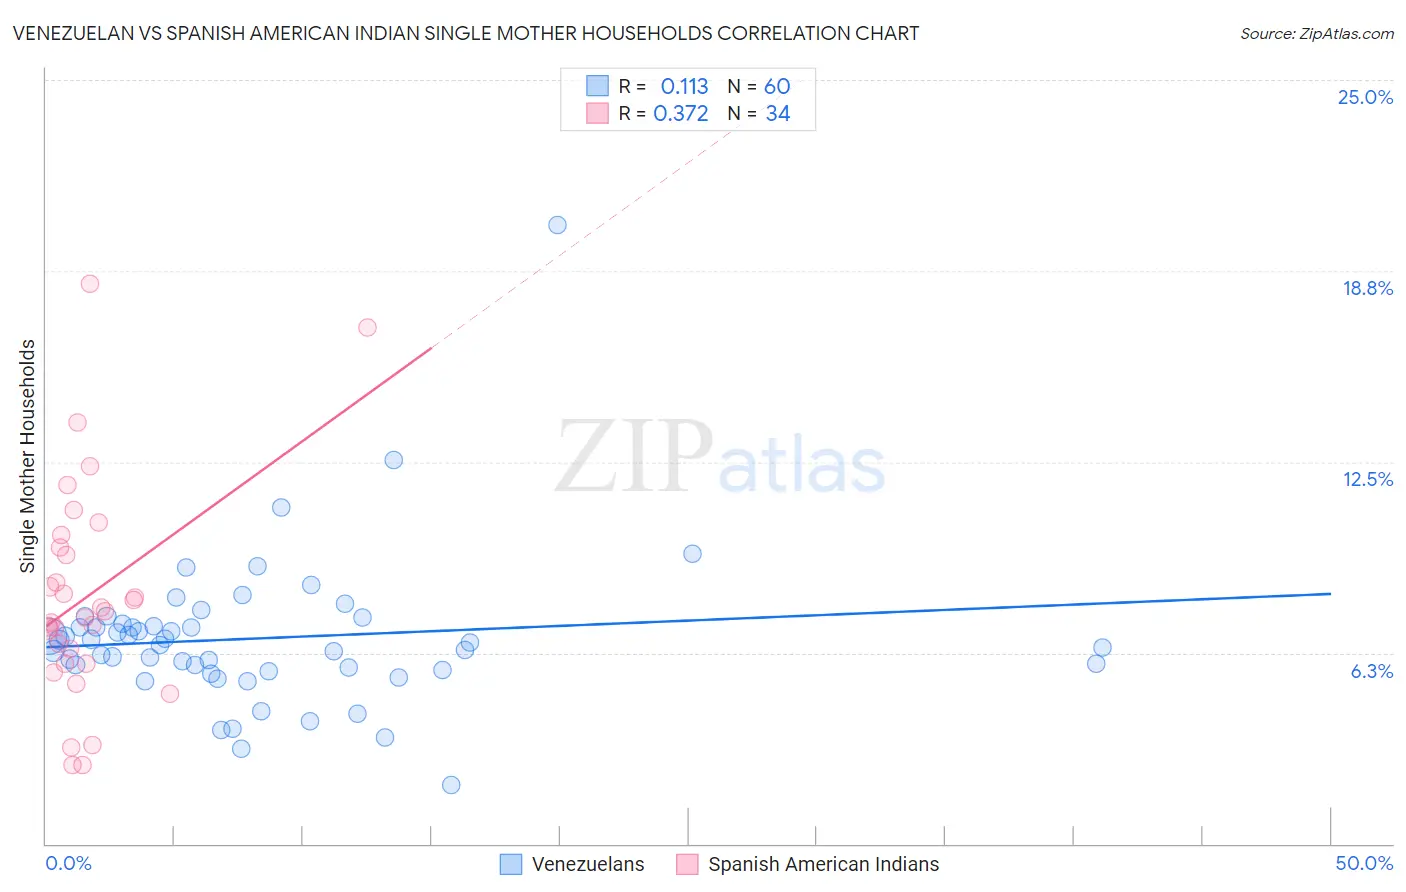
Venezuelan vs Spanish American Indian Single Mother Households Correlation Chart
The statistical analysis conducted on geographies consisting of 305,713,790 people shows a poor positive correlation between the proportion of Venezuelans and percentage of single mother households in the United States with a correlation coefficient (R) of 0.113 and weighted average of 6.6%. Similarly, the statistical analysis conducted on geographies consisting of 73,133,318 people shows a mild positive correlation between the proportion of Spanish American Indians and percentage of single mother households in the United States with a correlation coefficient (R) of 0.372 and weighted average of 7.3%, a difference of 9.3%.
Single Mother Households Correlation Summary
| Measurement | Venezuelan | Spanish American Indian |
| Minimum | 1.9% | 2.6% |
| Maximum | 20.3% | 18.3% |
| Range | 18.4% | 15.7% |
| Mean | 6.7% | 8.1% |
| Median | 6.6% | 7.5% |
| Interquartile 25% (IQ1) | 5.7% | 5.9% |
| Interquartile 75% (IQ3) | 7.2% | 9.7% |
| Interquartile Range (IQR) | 1.4% | 3.8% |
| Standard Deviation (Sample) | 2.5% | 3.6% |
| Standard Deviation (Population) | 2.5% | 3.5% |
Similar Demographics by Single Mother Households
Demographics Similar to Venezuelans by Single Mother Households
In terms of single mother households, the demographic groups most similar to Venezuelans are Guamanian/Chamorro (6.6%, a difference of 0.12%), Immigrants from Peru (6.7%, a difference of 0.21%), Immigrants from Fiji (6.7%, a difference of 0.22%), Cree (6.7%, a difference of 0.24%), and German Russian (6.7%, a difference of 0.32%).
| Demographics | Rating | Rank | Single Mother Households |
| Immigrants | Uganda | 18.3 /100 | #194 | Poor 6.6% |
| South Americans | 18.0 /100 | #195 | Poor 6.6% |
| Uruguayans | 18.0 /100 | #196 | Poor 6.6% |
| Moroccans | 17.4 /100 | #197 | Poor 6.6% |
| Hawaiians | 16.1 /100 | #198 | Poor 6.6% |
| Potawatomi | 15.5 /100 | #199 | Poor 6.6% |
| Immigrants | Ethiopia | 14.7 /100 | #200 | Poor 6.6% |
| Venezuelans | 12.9 /100 | #201 | Poor 6.6% |
| Guamanians/Chamorros | 12.4 /100 | #202 | Poor 6.6% |
| Immigrants | Peru | 12.0 /100 | #203 | Poor 6.7% |
| Immigrants | Fiji | 11.9 /100 | #204 | Poor 6.7% |
| Cree | 11.9 /100 | #205 | Poor 6.7% |
| German Russians | 11.5 /100 | #206 | Poor 6.7% |
| Immigrants | South America | 11.5 /100 | #207 | Poor 6.7% |
| Vietnamese | 11.3 /100 | #208 | Poor 6.7% |
Demographics Similar to Spanish American Indians by Single Mother Households
In terms of single mother households, the demographic groups most similar to Spanish American Indians are Dutch West Indian (7.3%, a difference of 0.030%), Nicaraguan (7.2%, a difference of 0.28%), Bermudan (7.3%, a difference of 0.29%), Immigrants from Africa (7.3%, a difference of 0.30%), and Immigrants from Cambodia (7.2%, a difference of 0.46%).
| Demographics | Rating | Rank | Single Mother Households |
| Immigrants | Portugal | 0.6 /100 | #241 | Tragic 7.2% |
| Fijians | 0.6 /100 | #242 | Tragic 7.2% |
| Ecuadorians | 0.6 /100 | #243 | Tragic 7.2% |
| Cubans | 0.6 /100 | #244 | Tragic 7.2% |
| Immigrants | Cambodia | 0.5 /100 | #245 | Tragic 7.2% |
| Nicaraguans | 0.5 /100 | #246 | Tragic 7.2% |
| Dutch West Indians | 0.4 /100 | #247 | Tragic 7.3% |
| Spanish American Indians | 0.4 /100 | #248 | Tragic 7.3% |
| Bermudans | 0.4 /100 | #249 | Tragic 7.3% |
| Immigrants | Africa | 0.4 /100 | #250 | Tragic 7.3% |
| Malaysians | 0.3 /100 | #251 | Tragic 7.3% |
| Alaskan Athabascans | 0.3 /100 | #252 | Tragic 7.3% |
| Cajuns | 0.3 /100 | #253 | Tragic 7.3% |
| Immigrants | Ecuador | 0.3 /100 | #254 | Tragic 7.3% |
| Mexican American Indians | 0.2 /100 | #255 | Tragic 7.4% |