Ute vs Immigrants from Netherlands Single Mother Households
COMPARE
Ute
Immigrants from Netherlands
Single Mother Households
Single Mother Households Comparison
Ute
Immigrants from Netherlands
7.1%
SINGLE MOTHER HOUSEHOLDS
1.0/ 100
METRIC RATING
236th/ 347
METRIC RANK
5.6%
SINGLE MOTHER HOUSEHOLDS
98.4/ 100
METRIC RATING
72nd/ 347
METRIC RANK
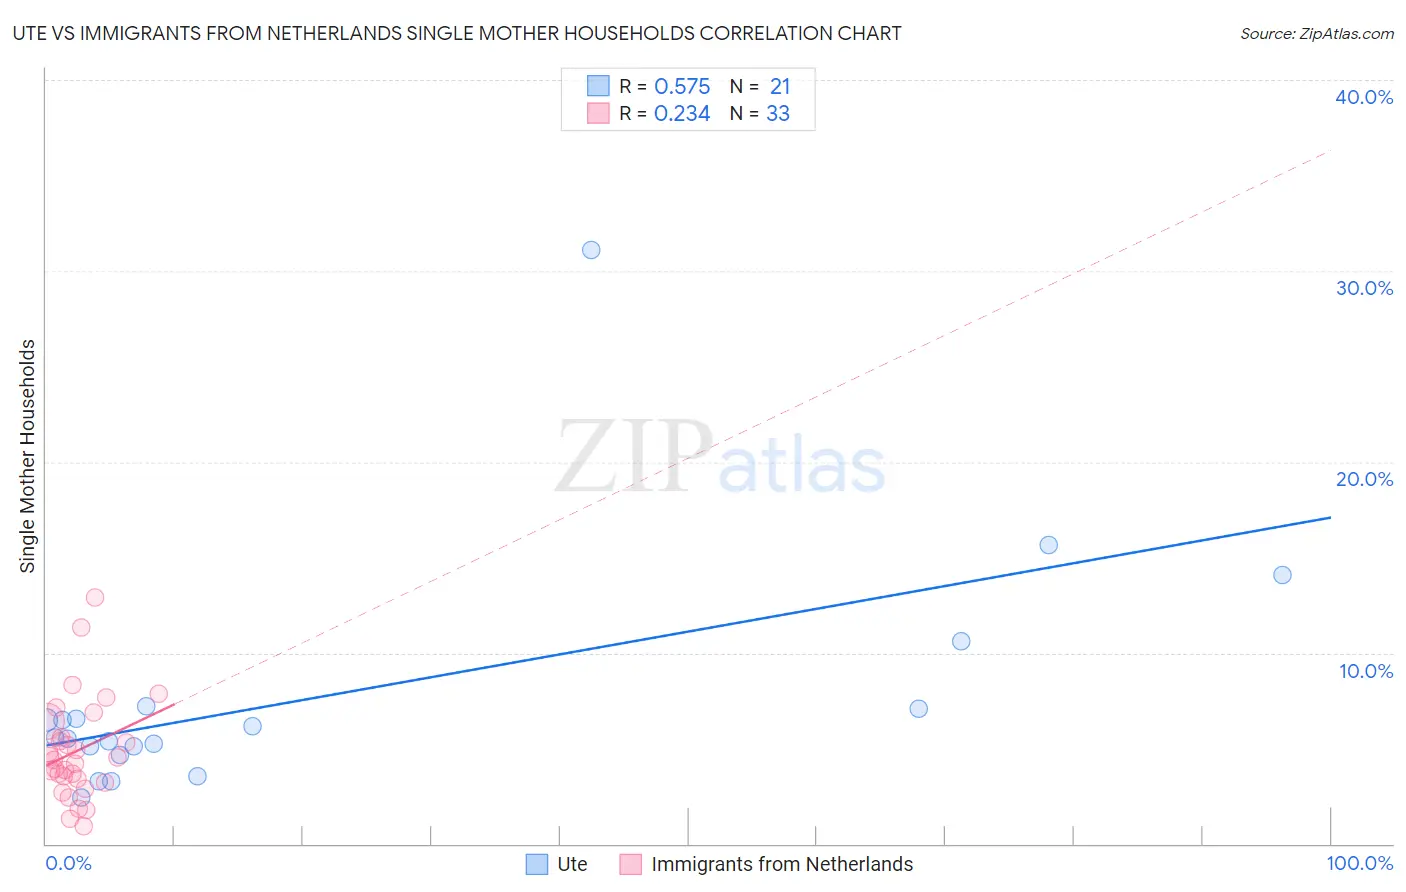
Ute vs Immigrants from Netherlands Single Mother Households Correlation Chart
The statistical analysis conducted on geographies consisting of 55,640,483 people shows a substantial positive correlation between the proportion of Ute and percentage of single mother households in the United States with a correlation coefficient (R) of 0.575 and weighted average of 7.1%. Similarly, the statistical analysis conducted on geographies consisting of 237,246,483 people shows a weak positive correlation between the proportion of Immigrants from Netherlands and percentage of single mother households in the United States with a correlation coefficient (R) of 0.234 and weighted average of 5.6%, a difference of 26.8%.
Single Mother Households Correlation Summary
| Measurement | Ute | Immigrants from Netherlands |
| Minimum | 2.4% | 0.89% |
| Maximum | 31.1% | 12.9% |
| Range | 28.6% | 12.0% |
| Mean | 7.6% | 4.9% |
| Median | 5.6% | 4.4% |
| Interquartile 25% (IQ1) | 4.9% | 3.3% |
| Interquartile 75% (IQ3) | 7.1% | 6.0% |
| Interquartile Range (IQR) | 2.3% | 2.7% |
| Standard Deviation (Sample) | 6.3% | 2.6% |
| Standard Deviation (Population) | 6.1% | 2.6% |
Similar Demographics by Single Mother Households
Demographics Similar to Ute by Single Mother Households
In terms of single mother households, the demographic groups most similar to Ute are Arapaho (7.1%, a difference of 0.090%), Panamanian (7.1%, a difference of 0.23%), Kiowa (7.1%, a difference of 0.50%), Immigrants from Burma/Myanmar (7.0%, a difference of 0.79%), and Immigrants from Panama (7.2%, a difference of 0.82%).
| Demographics | Rating | Rank | Single Mother Households |
| Immigrants | Kenya | 2.1 /100 | #229 | Tragic 7.0% |
| Creek | 1.6 /100 | #230 | Tragic 7.0% |
| Spanish Americans | 1.6 /100 | #231 | Tragic 7.0% |
| Comanche | 1.5 /100 | #232 | Tragic 7.0% |
| Choctaw | 1.4 /100 | #233 | Tragic 7.0% |
| Chickasaw | 1.4 /100 | #234 | Tragic 7.0% |
| Immigrants | Burma/Myanmar | 1.4 /100 | #235 | Tragic 7.0% |
| Ute | 1.0 /100 | #236 | Tragic 7.1% |
| Arapaho | 1.0 /100 | #237 | Tragic 7.1% |
| Panamanians | 0.9 /100 | #238 | Tragic 7.1% |
| Kiowa | 0.8 /100 | #239 | Tragic 7.1% |
| Immigrants | Panama | 0.7 /100 | #240 | Tragic 7.2% |
| Immigrants | Portugal | 0.6 /100 | #241 | Tragic 7.2% |
| Fijians | 0.6 /100 | #242 | Tragic 7.2% |
| Ecuadorians | 0.6 /100 | #243 | Tragic 7.2% |
Demographics Similar to Immigrants from Netherlands by Single Mother Households
In terms of single mother households, the demographic groups most similar to Immigrants from Netherlands are Immigrants from Asia (5.6%, a difference of 0.060%), Immigrants from Kazakhstan (5.6%, a difference of 0.090%), Immigrants from North America (5.6%, a difference of 0.090%), Immigrants from Eastern Europe (5.6%, a difference of 0.10%), and Asian (5.6%, a difference of 0.18%).
| Demographics | Rating | Rank | Single Mother Households |
| Greeks | 98.6 /100 | #65 | Exceptional 5.6% |
| Immigrants | Canada | 98.5 /100 | #66 | Exceptional 5.6% |
| Italians | 98.5 /100 | #67 | Exceptional 5.6% |
| Immigrants | Bulgaria | 98.5 /100 | #68 | Exceptional 5.6% |
| Asians | 98.5 /100 | #69 | Exceptional 5.6% |
| Immigrants | Eastern Europe | 98.4 /100 | #70 | Exceptional 5.6% |
| Immigrants | Kazakhstan | 98.4 /100 | #71 | Exceptional 5.6% |
| Immigrants | Netherlands | 98.4 /100 | #72 | Exceptional 5.6% |
| Immigrants | Asia | 98.4 /100 | #73 | Exceptional 5.6% |
| Immigrants | North America | 98.3 /100 | #74 | Exceptional 5.6% |
| Slovenes | 98.3 /100 | #75 | Exceptional 5.6% |
| New Zealanders | 98.2 /100 | #76 | Exceptional 5.6% |
| Romanians | 98.1 /100 | #77 | Exceptional 5.6% |
| Swiss | 98.1 /100 | #78 | Exceptional 5.6% |
| Immigrants | Sri Lanka | 98.0 /100 | #79 | Exceptional 5.6% |