Ute vs Immigrants from South Central Asia Currently Married
COMPARE
Ute
Immigrants from South Central Asia
Currently Married
Currently Married Comparison
Ute
Immigrants from South Central Asia
43.9%
CURRENTLY MARRIED
0.2/ 100
METRIC RATING
258th/ 347
METRIC RANK
50.0%
CURRENTLY MARRIED
100.0/ 100
METRIC RATING
7th/ 347
METRIC RANK
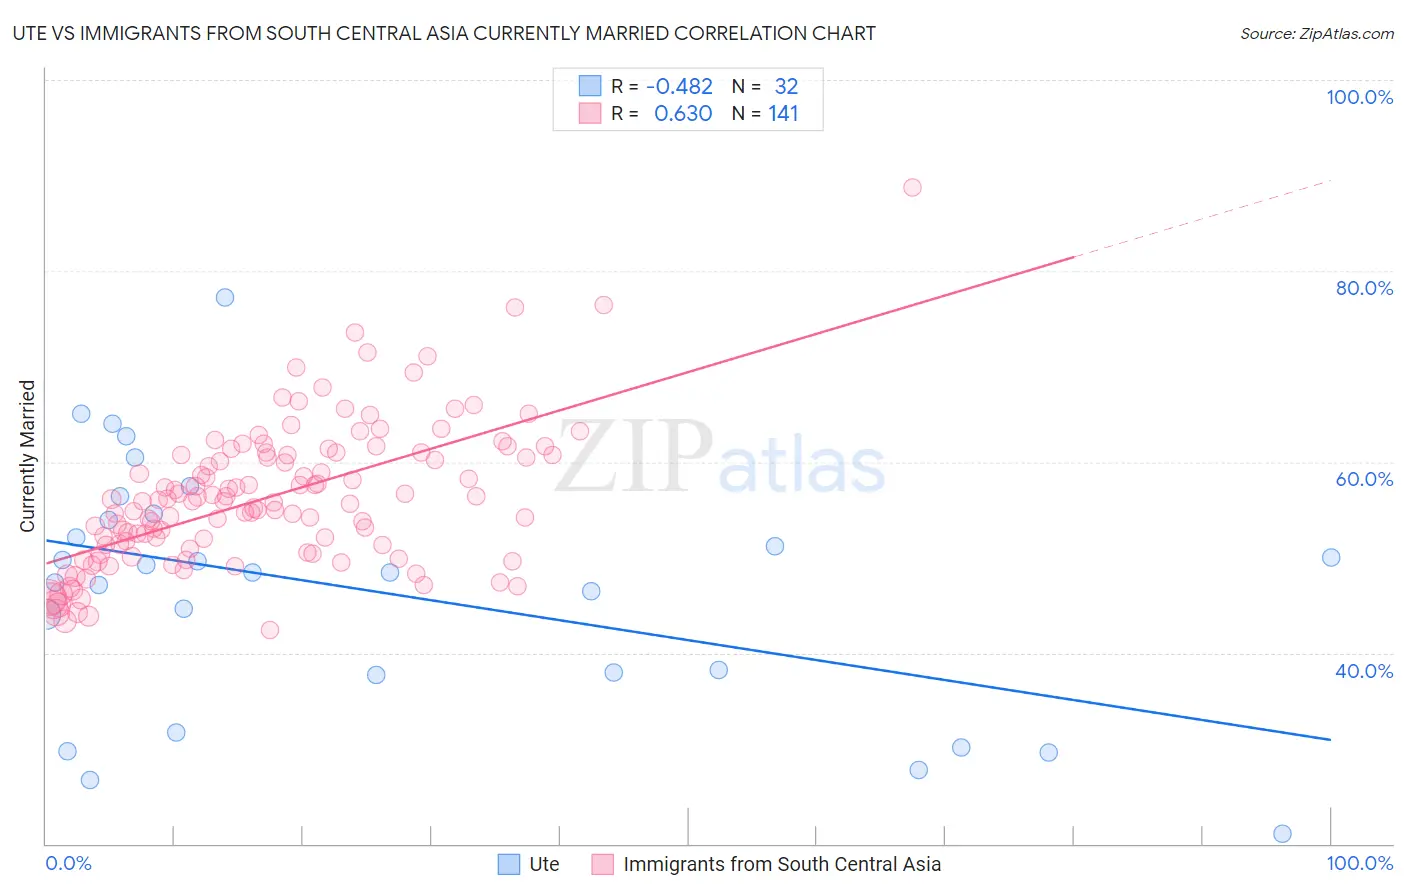
Ute vs Immigrants from South Central Asia Currently Married Correlation Chart
The statistical analysis conducted on geographies consisting of 55,668,599 people shows a moderate negative correlation between the proportion of Ute and percentage of population currently married in the United States with a correlation coefficient (R) of -0.482 and weighted average of 43.9%. Similarly, the statistical analysis conducted on geographies consisting of 473,021,987 people shows a significant positive correlation between the proportion of Immigrants from South Central Asia and percentage of population currently married in the United States with a correlation coefficient (R) of 0.630 and weighted average of 50.0%, a difference of 14.0%.
Currently Married Correlation Summary
| Measurement | Ute | Immigrants from South Central Asia |
| Minimum | 21.0% | 42.4% |
| Maximum | 77.2% | 88.7% |
| Range | 56.2% | 46.3% |
| Mean | 46.6% | 56.2% |
| Median | 48.4% | 55.8% |
| Interquartile 25% (IQ1) | 37.9% | 50.7% |
| Interquartile 75% (IQ3) | 54.2% | 60.7% |
| Interquartile Range (IQR) | 16.4% | 10.0% |
| Standard Deviation (Sample) | 12.9% | 7.4% |
| Standard Deviation (Population) | 12.7% | 7.4% |
Similar Demographics by Currently Married
Demographics Similar to Ute by Currently Married
In terms of currently married, the demographic groups most similar to Ute are Immigrants from Africa (43.9%, a difference of 0.010%), Shoshone (44.0%, a difference of 0.21%), Immigrants from Sierra Leone (43.8%, a difference of 0.21%), Yakama (44.0%, a difference of 0.26%), and Immigrants from Latin America (43.8%, a difference of 0.27%).
| Demographics | Rating | Rank | Currently Married |
| Blackfeet | 0.3 /100 | #251 | Tragic 44.2% |
| Hispanics or Latinos | 0.3 /100 | #252 | Tragic 44.1% |
| Immigrants | Central America | 0.3 /100 | #253 | Tragic 44.1% |
| Vietnamese | 0.2 /100 | #254 | Tragic 44.0% |
| Yakama | 0.2 /100 | #255 | Tragic 44.0% |
| Shoshone | 0.2 /100 | #256 | Tragic 44.0% |
| Immigrants | Africa | 0.2 /100 | #257 | Tragic 43.9% |
| Ute | 0.2 /100 | #258 | Tragic 43.9% |
| Immigrants | Sierra Leone | 0.1 /100 | #259 | Tragic 43.8% |
| Immigrants | Latin America | 0.1 /100 | #260 | Tragic 43.8% |
| Immigrants | Nicaragua | 0.1 /100 | #261 | Tragic 43.7% |
| Bangladeshis | 0.1 /100 | #262 | Tragic 43.7% |
| Immigrants | Cuba | 0.1 /100 | #263 | Tragic 43.7% |
| Sudanese | 0.1 /100 | #264 | Tragic 43.7% |
| Immigrants | Bangladesh | 0.1 /100 | #265 | Tragic 43.6% |
Demographics Similar to Immigrants from South Central Asia by Currently Married
In terms of currently married, the demographic groups most similar to Immigrants from South Central Asia are Swedish (50.0%, a difference of 0.13%), Czech (49.9%, a difference of 0.32%), Norwegian (50.2%, a difference of 0.34%), Filipino (49.7%, a difference of 0.58%), and English (49.7%, a difference of 0.59%).
| Demographics | Rating | Rank | Currently Married |
| Immigrants | India | 100.0 /100 | #1 | Exceptional 51.8% |
| Thais | 100.0 /100 | #2 | Exceptional 50.9% |
| Assyrians/Chaldeans/Syriacs | 100.0 /100 | #3 | Exceptional 50.8% |
| Immigrants | Taiwan | 100.0 /100 | #4 | Exceptional 50.7% |
| Danes | 100.0 /100 | #5 | Exceptional 50.5% |
| Norwegians | 100.0 /100 | #6 | Exceptional 50.2% |
| Immigrants | South Central Asia | 100.0 /100 | #7 | Exceptional 50.0% |
| Swedes | 100.0 /100 | #8 | Exceptional 50.0% |
| Czechs | 99.9 /100 | #9 | Exceptional 49.9% |
| Filipinos | 99.9 /100 | #10 | Exceptional 49.7% |
| English | 99.9 /100 | #11 | Exceptional 49.7% |
| Swiss | 99.9 /100 | #12 | Exceptional 49.7% |
| Dutch | 99.9 /100 | #13 | Exceptional 49.6% |
| Germans | 99.9 /100 | #14 | Exceptional 49.6% |
| Pennsylvania Germans | 99.9 /100 | #15 | Exceptional 49.6% |