Colville vs Immigrants from Netherlands Single Mother Households
COMPARE
Colville
Immigrants from Netherlands
Single Mother Households
Single Mother Households Comparison
Colville
Immigrants from Netherlands
8.0%
SINGLE MOTHER HOUSEHOLDS
0.0/ 100
METRIC RATING
305th/ 347
METRIC RANK
5.6%
SINGLE MOTHER HOUSEHOLDS
98.4/ 100
METRIC RATING
72nd/ 347
METRIC RANK
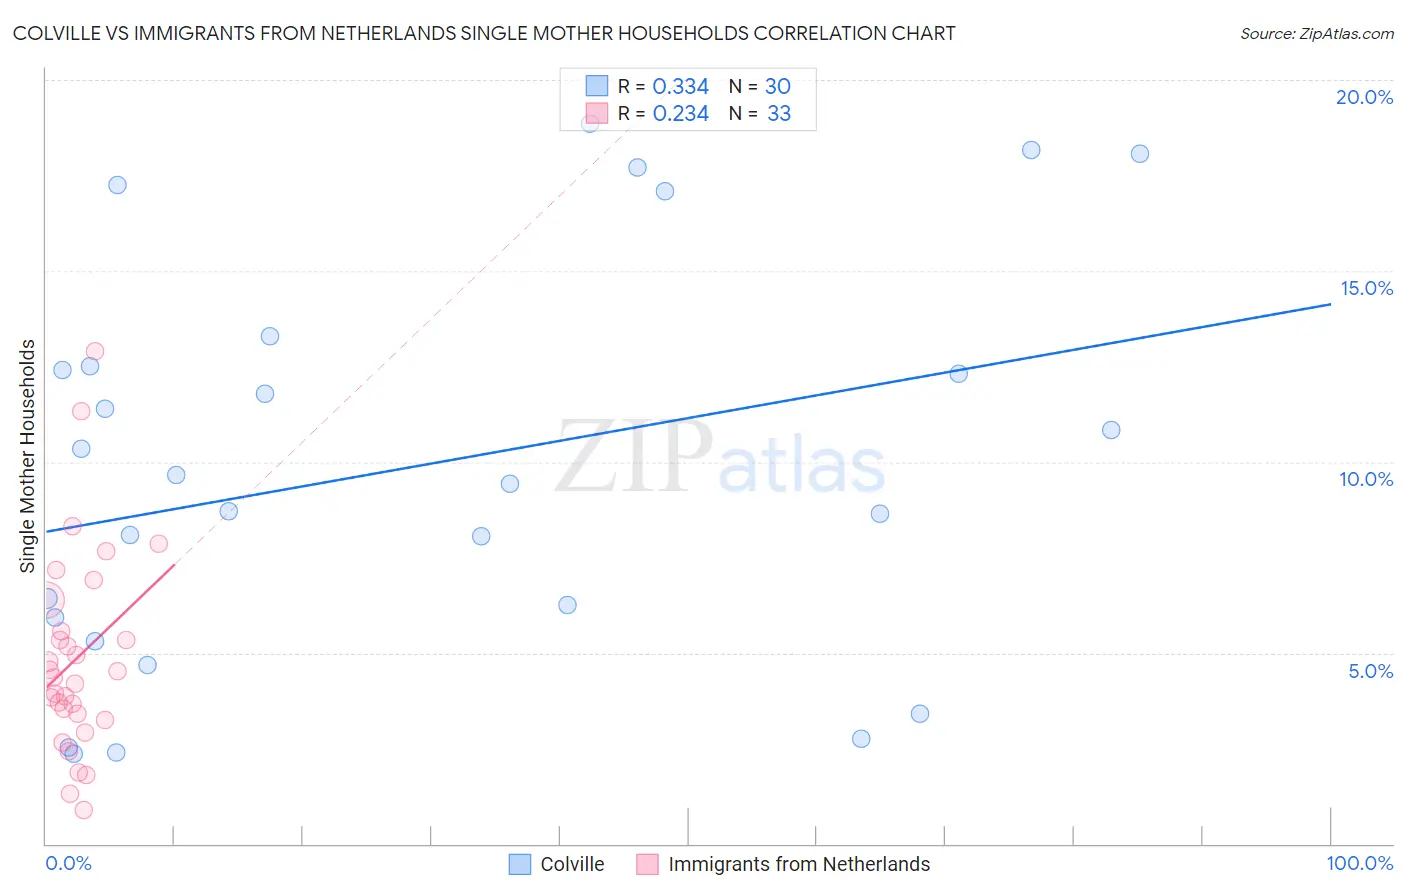
Colville vs Immigrants from Netherlands Single Mother Households Correlation Chart
The statistical analysis conducted on geographies consisting of 34,673,137 people shows a mild positive correlation between the proportion of Colville and percentage of single mother households in the United States with a correlation coefficient (R) of 0.334 and weighted average of 8.0%. Similarly, the statistical analysis conducted on geographies consisting of 237,246,483 people shows a weak positive correlation between the proportion of Immigrants from Netherlands and percentage of single mother households in the United States with a correlation coefficient (R) of 0.234 and weighted average of 5.6%, a difference of 43.3%.
Single Mother Households Correlation Summary
| Measurement | Colville | Immigrants from Netherlands |
| Minimum | 2.4% | 0.89% |
| Maximum | 18.9% | 12.9% |
| Range | 16.5% | 12.0% |
| Mean | 9.9% | 4.9% |
| Median | 9.5% | 4.4% |
| Interquartile 25% (IQ1) | 5.9% | 3.3% |
| Interquartile 75% (IQ3) | 12.5% | 6.0% |
| Interquartile Range (IQR) | 6.6% | 2.7% |
| Standard Deviation (Sample) | 5.2% | 2.6% |
| Standard Deviation (Population) | 5.1% | 2.6% |
Similar Demographics by Single Mother Households
Demographics Similar to Colville by Single Mother Households
In terms of single mother households, the demographic groups most similar to Colville are Native/Alaskan (8.0%, a difference of 0.050%), Immigrants from Barbados (8.0%, a difference of 0.070%), Immigrants from St. Vincent and the Grenadines (8.0%, a difference of 0.32%), Immigrants from Central America (8.1%, a difference of 0.33%), and Immigrants from Bahamas (8.0%, a difference of 0.49%).
| Demographics | Rating | Rank | Single Mother Households |
| Immigrants | West Indies | 0.0 /100 | #298 | Tragic 7.9% |
| Houma | 0.0 /100 | #299 | Tragic 7.9% |
| Mexicans | 0.0 /100 | #300 | Tragic 8.0% |
| Chippewa | 0.0 /100 | #301 | Tragic 8.0% |
| Immigrants | Ghana | 0.0 /100 | #302 | Tragic 8.0% |
| Immigrants | Bahamas | 0.0 /100 | #303 | Tragic 8.0% |
| Natives/Alaskans | 0.0 /100 | #304 | Tragic 8.0% |
| Colville | 0.0 /100 | #305 | Tragic 8.0% |
| Immigrants | Barbados | 0.0 /100 | #306 | Tragic 8.0% |
| Immigrants | St. Vincent and the Grenadines | 0.0 /100 | #307 | Tragic 8.0% |
| Immigrants | Central America | 0.0 /100 | #308 | Tragic 8.1% |
| Cheyenne | 0.0 /100 | #309 | Tragic 8.1% |
| Hondurans | 0.0 /100 | #310 | Tragic 8.1% |
| Immigrants | Congo | 0.0 /100 | #311 | Tragic 8.1% |
| Bangladeshis | 0.0 /100 | #312 | Tragic 8.1% |
Demographics Similar to Immigrants from Netherlands by Single Mother Households
In terms of single mother households, the demographic groups most similar to Immigrants from Netherlands are Immigrants from Asia (5.6%, a difference of 0.060%), Immigrants from Kazakhstan (5.6%, a difference of 0.090%), Immigrants from North America (5.6%, a difference of 0.090%), Immigrants from Eastern Europe (5.6%, a difference of 0.10%), and Asian (5.6%, a difference of 0.18%).
| Demographics | Rating | Rank | Single Mother Households |
| Greeks | 98.6 /100 | #65 | Exceptional 5.6% |
| Immigrants | Canada | 98.5 /100 | #66 | Exceptional 5.6% |
| Italians | 98.5 /100 | #67 | Exceptional 5.6% |
| Immigrants | Bulgaria | 98.5 /100 | #68 | Exceptional 5.6% |
| Asians | 98.5 /100 | #69 | Exceptional 5.6% |
| Immigrants | Eastern Europe | 98.4 /100 | #70 | Exceptional 5.6% |
| Immigrants | Kazakhstan | 98.4 /100 | #71 | Exceptional 5.6% |
| Immigrants | Netherlands | 98.4 /100 | #72 | Exceptional 5.6% |
| Immigrants | Asia | 98.4 /100 | #73 | Exceptional 5.6% |
| Immigrants | North America | 98.3 /100 | #74 | Exceptional 5.6% |
| Slovenes | 98.3 /100 | #75 | Exceptional 5.6% |
| New Zealanders | 98.2 /100 | #76 | Exceptional 5.6% |
| Romanians | 98.1 /100 | #77 | Exceptional 5.6% |
| Swiss | 98.1 /100 | #78 | Exceptional 5.6% |
| Immigrants | Sri Lanka | 98.0 /100 | #79 | Exceptional 5.6% |