Trinidadian and Tobagonian vs Immigrants from Netherlands Single Mother Households
COMPARE
Trinidadian and Tobagonian
Immigrants from Netherlands
Single Mother Households
Single Mother Households Comparison
Trinidadians and Tobagonians
Immigrants from Netherlands
7.7%
SINGLE MOTHER HOUSEHOLDS
0.0/ 100
METRIC RATING
285th/ 347
METRIC RANK
5.6%
SINGLE MOTHER HOUSEHOLDS
98.4/ 100
METRIC RATING
72nd/ 347
METRIC RANK
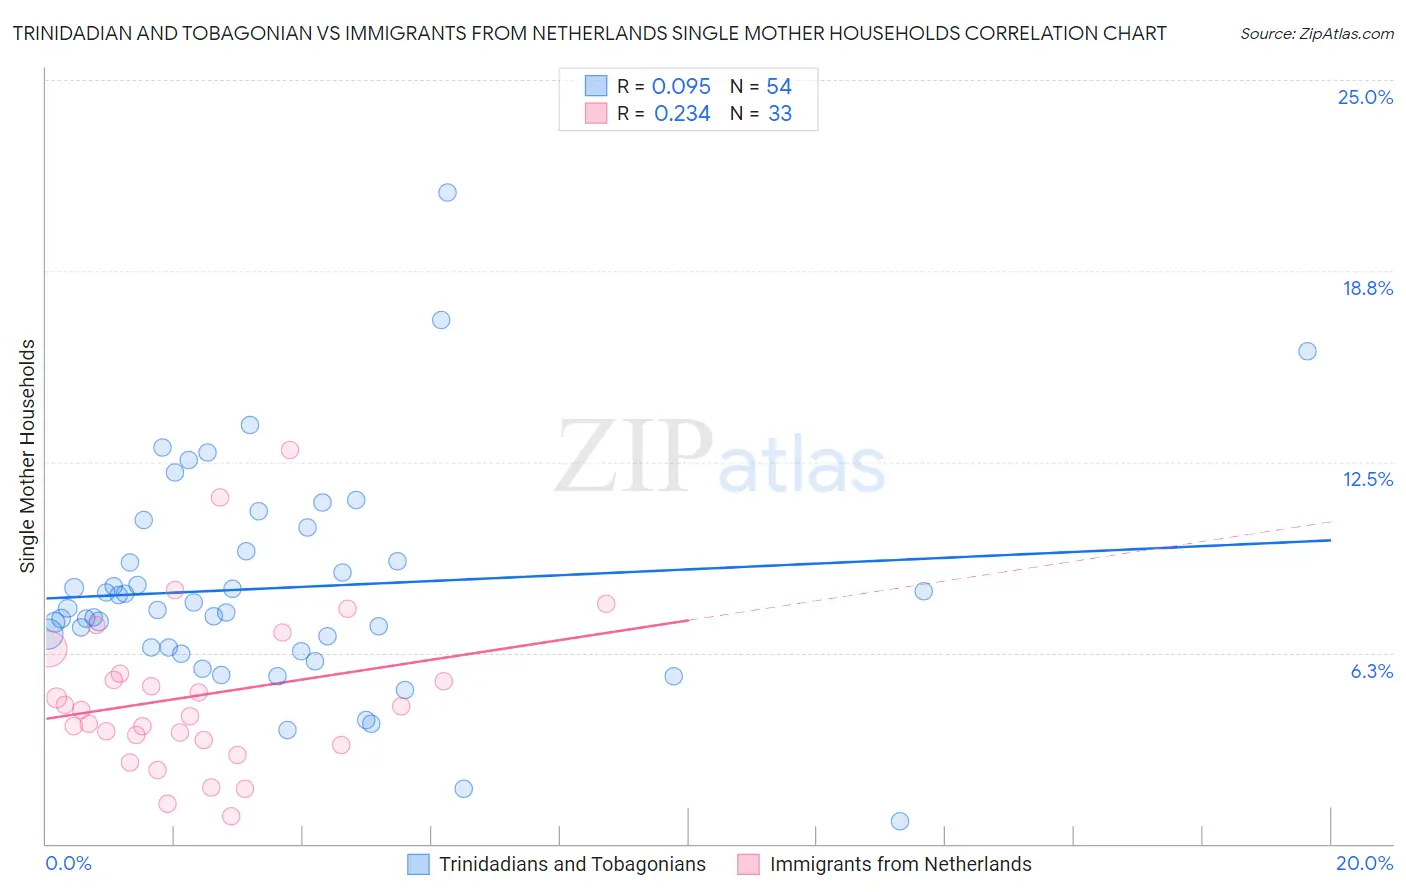
Trinidadian and Tobagonian vs Immigrants from Netherlands Single Mother Households Correlation Chart
The statistical analysis conducted on geographies consisting of 219,557,612 people shows a slight positive correlation between the proportion of Trinidadians and Tobagonians and percentage of single mother households in the United States with a correlation coefficient (R) of 0.095 and weighted average of 7.7%. Similarly, the statistical analysis conducted on geographies consisting of 237,246,483 people shows a weak positive correlation between the proportion of Immigrants from Netherlands and percentage of single mother households in the United States with a correlation coefficient (R) of 0.234 and weighted average of 5.6%, a difference of 37.7%.
Single Mother Households Correlation Summary
| Measurement | Trinidadian and Tobagonian | Immigrants from Netherlands |
| Minimum | 0.73% | 0.89% |
| Maximum | 21.3% | 12.9% |
| Range | 20.6% | 12.0% |
| Mean | 8.4% | 4.9% |
| Median | 7.7% | 4.4% |
| Interquartile 25% (IQ1) | 6.4% | 3.3% |
| Interquartile 75% (IQ3) | 9.6% | 6.0% |
| Interquartile Range (IQR) | 3.2% | 2.7% |
| Standard Deviation (Sample) | 3.6% | 2.6% |
| Standard Deviation (Population) | 3.6% | 2.6% |
Similar Demographics by Single Mother Households
Demographics Similar to Trinidadians and Tobagonians by Single Mother Households
In terms of single mother households, the demographic groups most similar to Trinidadians and Tobagonians are Immigrants from Belize (7.7%, a difference of 0.030%), Immigrants from Middle Africa (7.7%, a difference of 0.11%), Immigrants from Guatemala (7.7%, a difference of 0.21%), Sierra Leonean (7.7%, a difference of 0.26%), and Nigerian (7.7%, a difference of 0.63%).
| Demographics | Rating | Rank | Single Mother Households |
| Central Americans | 0.1 /100 | #278 | Tragic 7.6% |
| Immigrants | El Salvador | 0.0 /100 | #279 | Tragic 7.6% |
| Immigrants | Sierra Leone | 0.0 /100 | #280 | Tragic 7.7% |
| Immigrants | Laos | 0.0 /100 | #281 | Tragic 7.7% |
| Guatemalans | 0.0 /100 | #282 | Tragic 7.7% |
| Nigerians | 0.0 /100 | #283 | Tragic 7.7% |
| Immigrants | Belize | 0.0 /100 | #284 | Tragic 7.7% |
| Trinidadians and Tobagonians | 0.0 /100 | #285 | Tragic 7.7% |
| Immigrants | Middle Africa | 0.0 /100 | #286 | Tragic 7.7% |
| Immigrants | Guatemala | 0.0 /100 | #287 | Tragic 7.7% |
| Sierra Leoneans | 0.0 /100 | #288 | Tragic 7.7% |
| Sub-Saharan Africans | 0.0 /100 | #289 | Tragic 7.8% |
| Immigrants | Nigeria | 0.0 /100 | #290 | Tragic 7.8% |
| West Indians | 0.0 /100 | #291 | Tragic 7.8% |
| Ghanaians | 0.0 /100 | #292 | Tragic 7.8% |
Demographics Similar to Immigrants from Netherlands by Single Mother Households
In terms of single mother households, the demographic groups most similar to Immigrants from Netherlands are Immigrants from Asia (5.6%, a difference of 0.060%), Immigrants from Kazakhstan (5.6%, a difference of 0.090%), Immigrants from North America (5.6%, a difference of 0.090%), Immigrants from Eastern Europe (5.6%, a difference of 0.10%), and Asian (5.6%, a difference of 0.18%).
| Demographics | Rating | Rank | Single Mother Households |
| Greeks | 98.6 /100 | #65 | Exceptional 5.6% |
| Immigrants | Canada | 98.5 /100 | #66 | Exceptional 5.6% |
| Italians | 98.5 /100 | #67 | Exceptional 5.6% |
| Immigrants | Bulgaria | 98.5 /100 | #68 | Exceptional 5.6% |
| Asians | 98.5 /100 | #69 | Exceptional 5.6% |
| Immigrants | Eastern Europe | 98.4 /100 | #70 | Exceptional 5.6% |
| Immigrants | Kazakhstan | 98.4 /100 | #71 | Exceptional 5.6% |
| Immigrants | Netherlands | 98.4 /100 | #72 | Exceptional 5.6% |
| Immigrants | Asia | 98.4 /100 | #73 | Exceptional 5.6% |
| Immigrants | North America | 98.3 /100 | #74 | Exceptional 5.6% |
| Slovenes | 98.3 /100 | #75 | Exceptional 5.6% |
| New Zealanders | 98.2 /100 | #76 | Exceptional 5.6% |
| Romanians | 98.1 /100 | #77 | Exceptional 5.6% |
| Swiss | 98.1 /100 | #78 | Exceptional 5.6% |
| Immigrants | Sri Lanka | 98.0 /100 | #79 | Exceptional 5.6% |