Immigrants from Central America vs Immigrants from the Azores Births to Unmarried Women
COMPARE
Immigrants from Central America
Immigrants from the Azores
Births to Unmarried Women
Births to Unmarried Women Comparison
Immigrants from Central America
Immigrants from the Azores
37.4%
BIRTHS TO UNMARRIED WOMEN
0.0/ 100
METRIC RATING
284th/ 347
METRIC RANK
39.6%
BIRTHS TO UNMARRIED WOMEN
0.0/ 100
METRIC RATING
311th/ 347
METRIC RANK
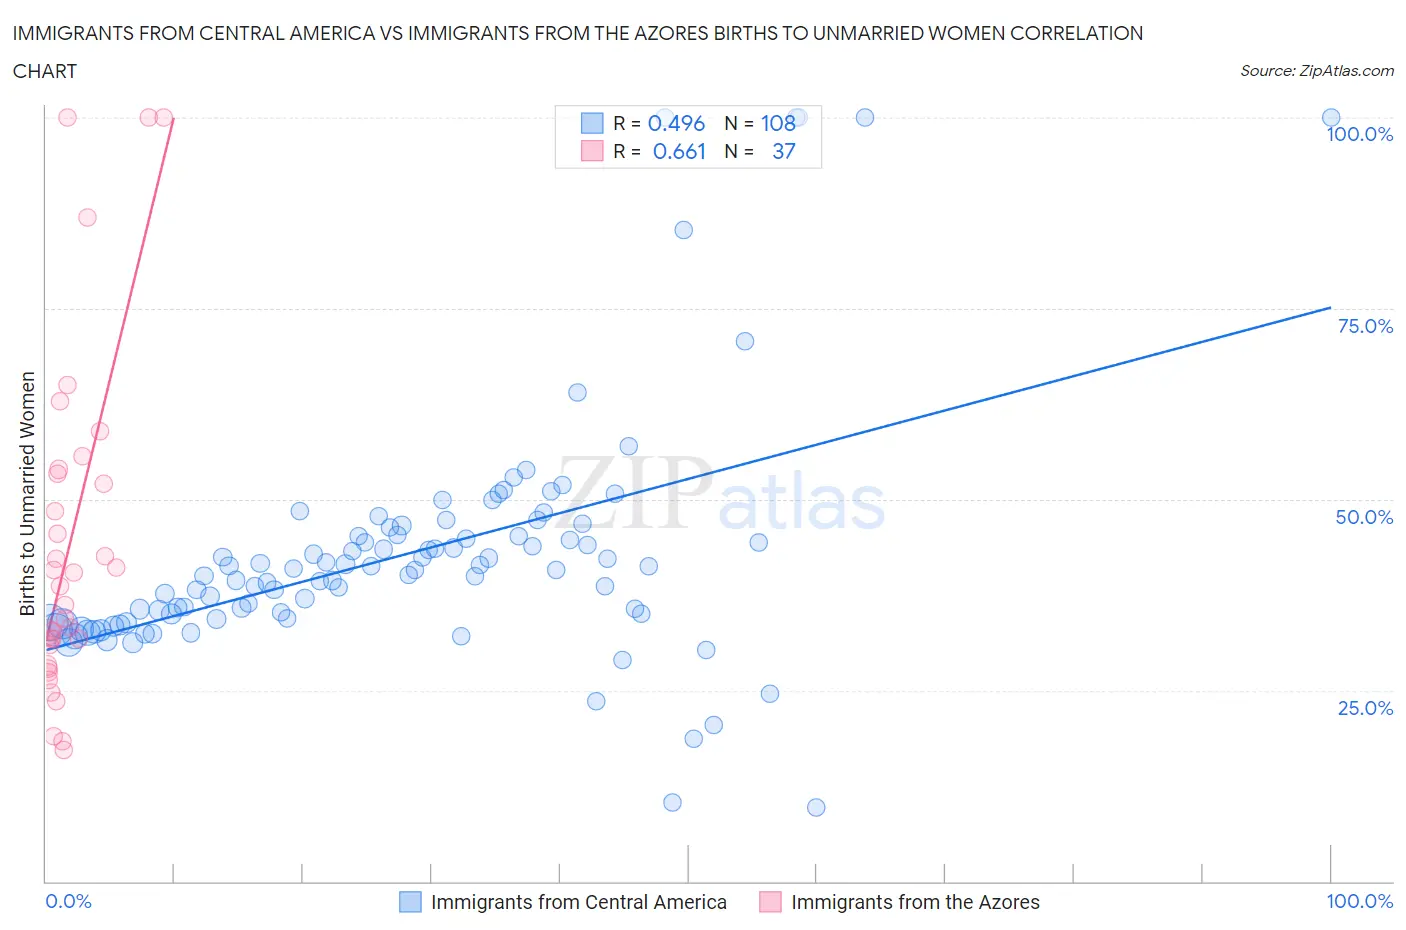
Immigrants from Central America vs Immigrants from the Azores Births to Unmarried Women Correlation Chart
The statistical analysis conducted on geographies consisting of 486,080,403 people shows a moderate positive correlation between the proportion of Immigrants from Central America and percentage of births to unmarried women in the United States with a correlation coefficient (R) of 0.496 and weighted average of 37.4%. Similarly, the statistical analysis conducted on geographies consisting of 45,022,253 people shows a significant positive correlation between the proportion of Immigrants from the Azores and percentage of births to unmarried women in the United States with a correlation coefficient (R) of 0.661 and weighted average of 39.6%, a difference of 5.7%.
Births to Unmarried Women Correlation Summary
| Measurement | Immigrants from Central America | Immigrants from the Azores |
| Minimum | 9.7% | 17.2% |
| Maximum | 100.0% | 100.0% |
| Range | 90.3% | 82.8% |
| Mean | 42.8% | 44.2% |
| Median | 40.7% | 38.6% |
| Interquartile 25% (IQ1) | 34.4% | 29.6% |
| Interquartile 75% (IQ3) | 45.2% | 53.6% |
| Interquartile Range (IQR) | 10.9% | 24.0% |
| Standard Deviation (Sample) | 16.0% | 22.2% |
| Standard Deviation (Population) | 16.0% | 21.9% |
Similar Demographics by Births to Unmarried Women
Demographics Similar to Immigrants from Central America by Births to Unmarried Women
In terms of births to unmarried women, the demographic groups most similar to Immigrants from Central America are Spanish American Indian (37.4%, a difference of 0.060%), Immigrants from Mexico (37.5%, a difference of 0.10%), Immigrants from Guatemala (37.5%, a difference of 0.11%), Liberian (37.4%, a difference of 0.14%), and Immigrants from Belize (37.3%, a difference of 0.31%).
| Demographics | Rating | Rank | Births to Unmarried Women |
| Guatemalans | 0.1 /100 | #277 | Tragic 37.1% |
| Immigrants | Latin America | 0.1 /100 | #278 | Tragic 37.1% |
| West Indians | 0.1 /100 | #279 | Tragic 37.3% |
| Immigrants | St. Vincent and the Grenadines | 0.1 /100 | #280 | Tragic 37.3% |
| Immigrants | Belize | 0.1 /100 | #281 | Tragic 37.3% |
| Liberians | 0.0 /100 | #282 | Tragic 37.4% |
| Spanish American Indians | 0.0 /100 | #283 | Tragic 37.4% |
| Immigrants | Central America | 0.0 /100 | #284 | Tragic 37.4% |
| Immigrants | Mexico | 0.0 /100 | #285 | Tragic 37.5% |
| Immigrants | Guatemala | 0.0 /100 | #286 | Tragic 37.5% |
| Creek | 0.0 /100 | #287 | Tragic 37.6% |
| Immigrants | Liberia | 0.0 /100 | #288 | Tragic 37.6% |
| Alaskan Athabascans | 0.0 /100 | #289 | Tragic 37.7% |
| Hispanics or Latinos | 0.0 /100 | #290 | Tragic 37.8% |
| Seminole | 0.0 /100 | #291 | Tragic 37.9% |
Demographics Similar to Immigrants from the Azores by Births to Unmarried Women
In terms of births to unmarried women, the demographic groups most similar to Immigrants from the Azores are U.S. Virgin Islander (39.6%, a difference of 0.020%), Immigrants from Dominica (39.5%, a difference of 0.23%), African (39.7%, a difference of 0.36%), Cuban (39.4%, a difference of 0.46%), and Aleut (39.3%, a difference of 0.58%).
| Demographics | Rating | Rank | Births to Unmarried Women |
| Yaqui | 0.0 /100 | #304 | Tragic 38.8% |
| Immigrants | Haiti | 0.0 /100 | #305 | Tragic 38.9% |
| Central American Indians | 0.0 /100 | #306 | Tragic 39.0% |
| Immigrants | Honduras | 0.0 /100 | #307 | Tragic 39.3% |
| Aleuts | 0.0 /100 | #308 | Tragic 39.3% |
| Cubans | 0.0 /100 | #309 | Tragic 39.4% |
| Immigrants | Dominica | 0.0 /100 | #310 | Tragic 39.5% |
| Immigrants | Azores | 0.0 /100 | #311 | Tragic 39.6% |
| U.S. Virgin Islanders | 0.0 /100 | #312 | Tragic 39.6% |
| Africans | 0.0 /100 | #313 | Tragic 39.7% |
| Immigrants | Caribbean | 0.0 /100 | #314 | Tragic 39.8% |
| Dominicans | 0.0 /100 | #315 | Tragic 39.8% |
| Apache | 0.0 /100 | #316 | Tragic 39.9% |
| Immigrants | Dominican Republic | 0.0 /100 | #317 | Tragic 40.1% |
| Immigrants | Bahamas | 0.0 /100 | #318 | Tragic 40.1% |