U.S. Virgin Islander vs Cape Verdean 4th Grade
COMPARE
U.S. Virgin Islander
Cape Verdean
4th Grade
4th Grade Comparison
U.S. Virgin Islanders
Cape Verdeans
97.1%
4TH GRADE
1.4/ 100
METRIC RATING
243rd/ 347
METRIC RANK
96.2%
4TH GRADE
0.0/ 100
METRIC RATING
312th/ 347
METRIC RANK
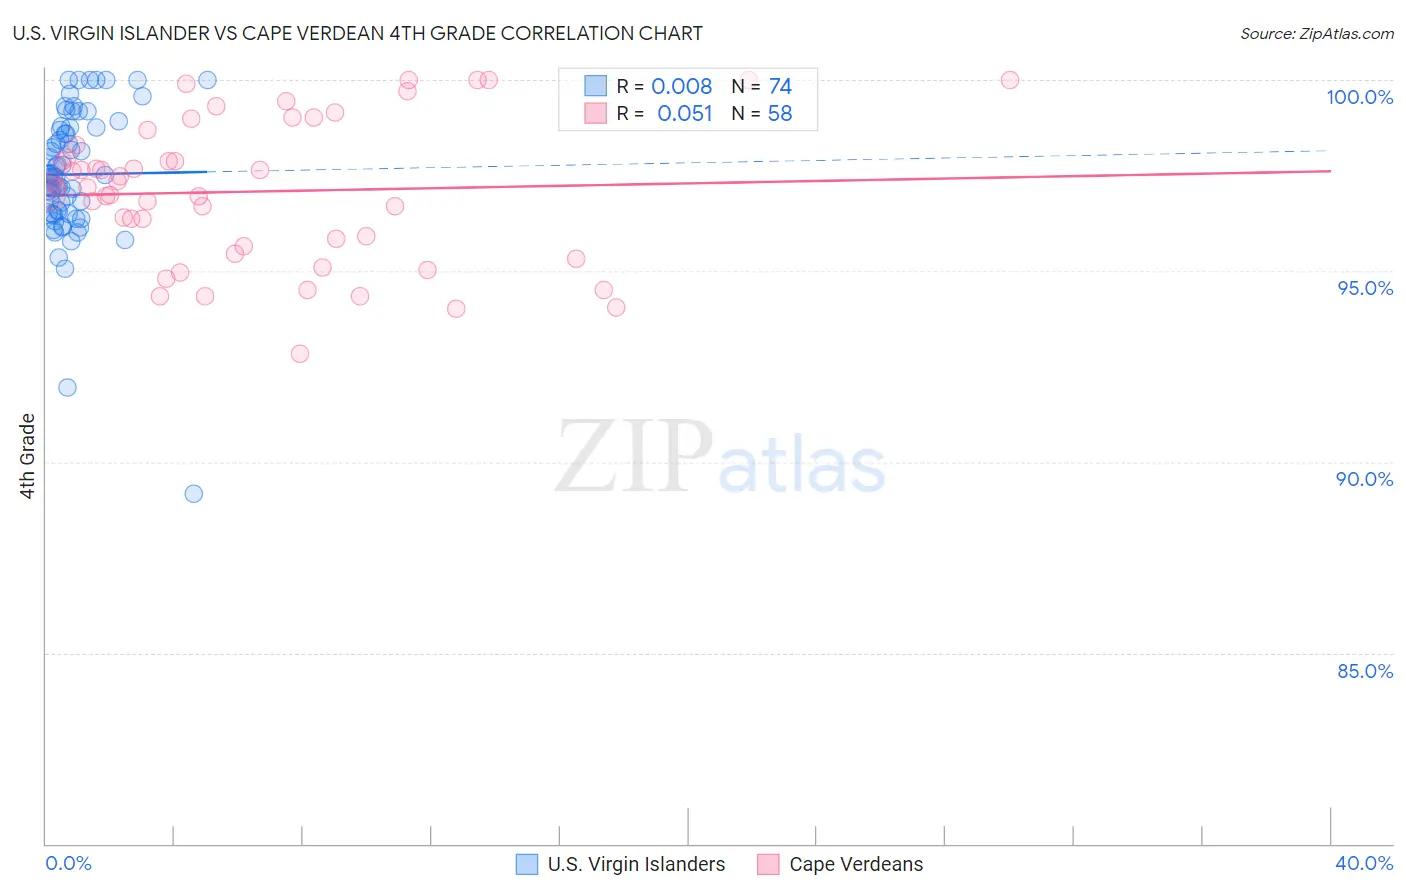
U.S. Virgin Islander vs Cape Verdean 4th Grade Correlation Chart
The statistical analysis conducted on geographies consisting of 87,529,315 people shows no correlation between the proportion of U.S. Virgin Islanders and percentage of population with at least 4th grade education in the United States with a correlation coefficient (R) of 0.008 and weighted average of 97.1%. Similarly, the statistical analysis conducted on geographies consisting of 107,537,955 people shows a slight positive correlation between the proportion of Cape Verdeans and percentage of population with at least 4th grade education in the United States with a correlation coefficient (R) of 0.051 and weighted average of 96.2%, a difference of 0.92%.
4th Grade Correlation Summary
| Measurement | U.S. Virgin Islander | Cape Verdean |
| Minimum | 89.2% | 92.8% |
| Maximum | 100.0% | 100.0% |
| Range | 10.8% | 7.2% |
| Mean | 97.5% | 97.1% |
| Median | 97.5% | 97.2% |
| Interquartile 25% (IQ1) | 96.5% | 95.7% |
| Interquartile 75% (IQ3) | 98.7% | 98.3% |
| Interquartile Range (IQR) | 2.2% | 2.7% |
| Standard Deviation (Sample) | 1.8% | 1.9% |
| Standard Deviation (Population) | 1.8% | 1.8% |
Similar Demographics by 4th Grade
Demographics Similar to U.S. Virgin Islanders by 4th Grade
In terms of 4th grade, the demographic groups most similar to U.S. Virgin Islanders are Asian (97.1%, a difference of 0.0%), Immigrants from Indonesia (97.1%, a difference of 0.010%), Korean (97.1%, a difference of 0.010%), Immigrants from Eastern Africa (97.1%, a difference of 0.010%), and Immigrants from Uruguay (97.1%, a difference of 0.010%).
| Demographics | Rating | Rank | 4th Grade |
| Immigrants | Eastern Asia | 2.7 /100 | #236 | Tragic 97.2% |
| Immigrants | Costa Rica | 2.0 /100 | #237 | Tragic 97.2% |
| Indians (Asian) | 1.9 /100 | #238 | Tragic 97.2% |
| Nigerians | 1.8 /100 | #239 | Tragic 97.1% |
| Colombians | 1.6 /100 | #240 | Tragic 97.1% |
| Immigrants | Indonesia | 1.5 /100 | #241 | Tragic 97.1% |
| Asians | 1.4 /100 | #242 | Tragic 97.1% |
| U.S. Virgin Islanders | 1.4 /100 | #243 | Tragic 97.1% |
| Koreans | 1.3 /100 | #244 | Tragic 97.1% |
| Immigrants | Eastern Africa | 1.2 /100 | #245 | Tragic 97.1% |
| Immigrants | Uruguay | 1.2 /100 | #246 | Tragic 97.1% |
| Ethiopians | 1.2 /100 | #247 | Tragic 97.1% |
| Immigrants | Asia | 1.2 /100 | #248 | Tragic 97.1% |
| Immigrants | Africa | 1.0 /100 | #249 | Tragic 97.1% |
| Immigrants | Senegal | 0.9 /100 | #250 | Tragic 97.1% |
Demographics Similar to Cape Verdeans by 4th Grade
In terms of 4th grade, the demographic groups most similar to Cape Verdeans are Immigrants from Bangladesh (96.2%, a difference of 0.010%), Indonesian (96.2%, a difference of 0.020%), Vietnamese (96.2%, a difference of 0.020%), Nicaraguan (96.2%, a difference of 0.030%), and Immigrants from Ecuador (96.2%, a difference of 0.030%).
| Demographics | Rating | Rank | 4th Grade |
| Immigrants | Caribbean | 0.0 /100 | #305 | Tragic 96.4% |
| Sri Lankans | 0.0 /100 | #306 | Tragic 96.4% |
| Immigrants | Haiti | 0.0 /100 | #307 | Tragic 96.3% |
| Immigrants | Laos | 0.0 /100 | #308 | Tragic 96.3% |
| Immigrants | Guyana | 0.0 /100 | #309 | Tragic 96.3% |
| Immigrants | Burma/Myanmar | 0.0 /100 | #310 | Tragic 96.3% |
| Immigrants | Bangladesh | 0.0 /100 | #311 | Tragic 96.2% |
| Cape Verdeans | 0.0 /100 | #312 | Tragic 96.2% |
| Indonesians | 0.0 /100 | #313 | Tragic 96.2% |
| Vietnamese | 0.0 /100 | #314 | Tragic 96.2% |
| Nicaraguans | 0.0 /100 | #315 | Tragic 96.2% |
| Immigrants | Ecuador | 0.0 /100 | #316 | Tragic 96.2% |
| Central American Indians | 0.0 /100 | #317 | Tragic 96.2% |
| Immigrants | Azores | 0.0 /100 | #318 | Tragic 96.1% |
| Belizeans | 0.0 /100 | #319 | Tragic 96.1% |