U.S. Virgin Islander vs Cape Verdean Family Households with Children
COMPARE
U.S. Virgin Islander
Cape Verdean
Family Households with Children
Family Households with Children Comparison
U.S. Virgin Islanders
Cape Verdeans
27.1%
FAMILY HOUSEHOLDS WITH CHILDREN
12.1/ 100
METRIC RATING
217th/ 347
METRIC RANK
26.9%
FAMILY HOUSEHOLDS WITH CHILDREN
3.6/ 100
METRIC RATING
236th/ 347
METRIC RANK
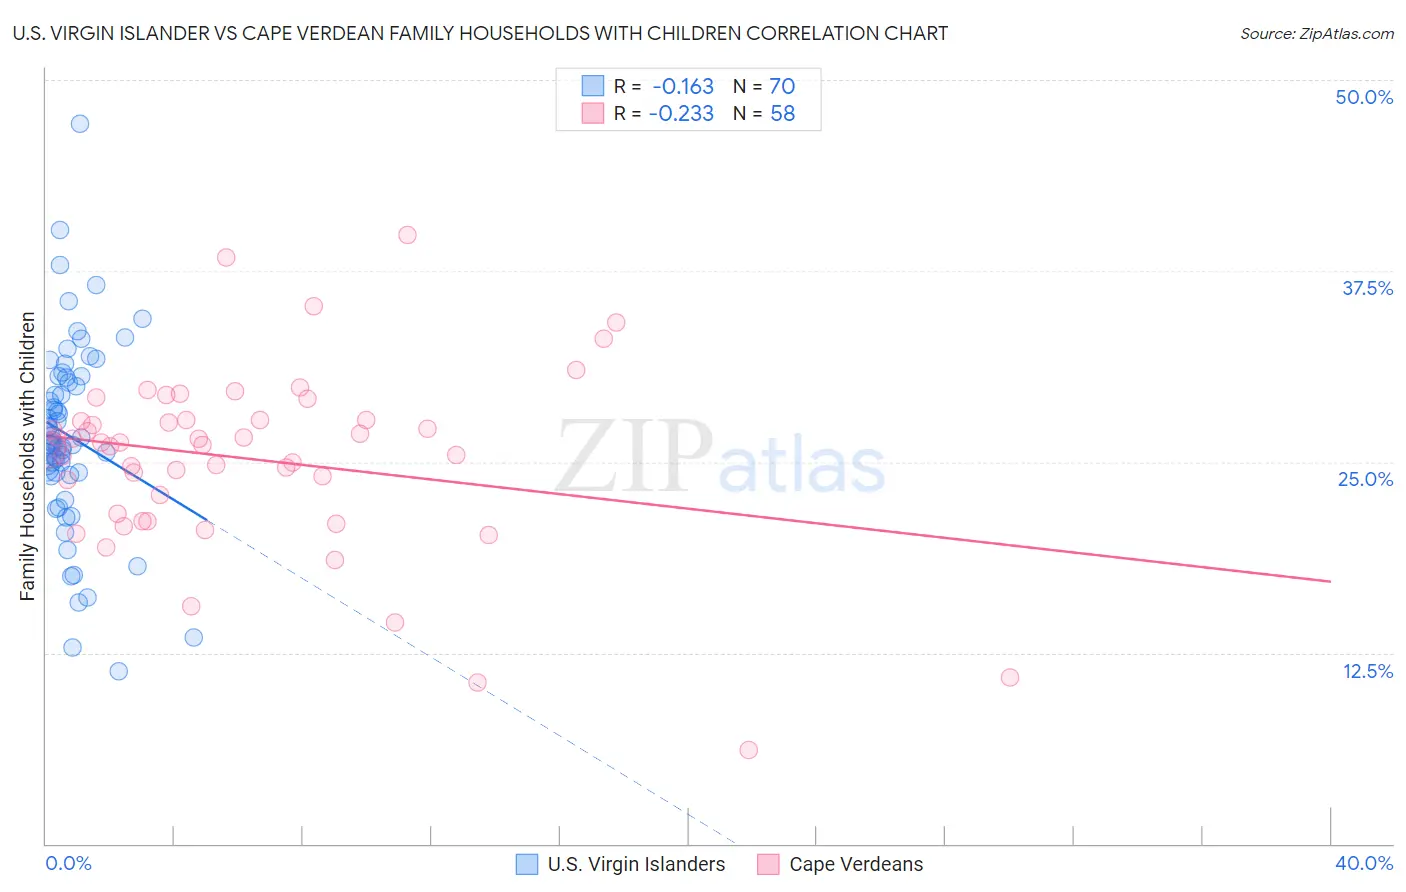
U.S. Virgin Islander vs Cape Verdean Family Households with Children Correlation Chart
The statistical analysis conducted on geographies consisting of 87,501,464 people shows a poor negative correlation between the proportion of U.S. Virgin Islanders and percentage of family households with children in the United States with a correlation coefficient (R) of -0.163 and weighted average of 27.1%. Similarly, the statistical analysis conducted on geographies consisting of 107,535,448 people shows a weak negative correlation between the proportion of Cape Verdeans and percentage of family households with children in the United States with a correlation coefficient (R) of -0.233 and weighted average of 26.9%, a difference of 0.74%.
Family Households with Children Correlation Summary
| Measurement | U.S. Virgin Islander | Cape Verdean |
| Minimum | 11.3% | 6.1% |
| Maximum | 47.1% | 39.9% |
| Range | 35.8% | 33.7% |
| Mean | 26.7% | 25.2% |
| Median | 26.2% | 26.2% |
| Interquartile 25% (IQ1) | 24.3% | 21.6% |
| Interquartile 75% (IQ3) | 30.5% | 27.8% |
| Interquartile Range (IQR) | 6.3% | 6.1% |
| Standard Deviation (Sample) | 6.2% | 6.1% |
| Standard Deviation (Population) | 6.2% | 6.0% |
Demographics Similar to U.S. Virgin Islanders and Cape Verdeans by Family Households with Children
In terms of family households with children, the demographic groups most similar to U.S. Virgin Islanders are Cuban (27.1%, a difference of 0.0%), Greek (27.1%, a difference of 0.040%), Immigrants from Japan (27.1%, a difference of 0.080%), Austrian (27.1%, a difference of 0.13%), and New Zealander (27.1%, a difference of 0.15%). Similarly, the demographic groups most similar to Cape Verdeans are Immigrants from Morocco (27.0%, a difference of 0.090%), Immigrants from Germany (27.0%, a difference of 0.13%), Immigrants from Italy (27.0%, a difference of 0.20%), Yugoslavian (27.0%, a difference of 0.21%), and Luxembourger (27.0%, a difference of 0.26%).
| Demographics | Rating | Rank | Family Households with Children |
| Cubans | 12.2 /100 | #216 | Poor 27.1% |
| U.S. Virgin Islanders | 12.1 /100 | #217 | Poor 27.1% |
| Greeks | 11.4 /100 | #218 | Poor 27.1% |
| Immigrants | Japan | 10.7 /100 | #219 | Poor 27.1% |
| Austrians | 9.9 /100 | #220 | Tragic 27.1% |
| New Zealanders | 9.6 /100 | #221 | Tragic 27.1% |
| Paraguayans | 9.4 /100 | #222 | Tragic 27.1% |
| Pima | 9.2 /100 | #223 | Tragic 27.1% |
| Germans | 8.7 /100 | #224 | Tragic 27.1% |
| Canadians | 7.5 /100 | #225 | Tragic 27.1% |
| Czechoslovakians | 6.6 /100 | #226 | Tragic 27.0% |
| Tsimshian | 6.6 /100 | #227 | Tragic 27.0% |
| Scottish | 6.5 /100 | #228 | Tragic 27.0% |
| Immigrants | Caribbean | 6.3 /100 | #229 | Tragic 27.0% |
| Bulgarians | 5.8 /100 | #230 | Tragic 27.0% |
| Luxembourgers | 5.5 /100 | #231 | Tragic 27.0% |
| Yugoslavians | 5.1 /100 | #232 | Tragic 27.0% |
| Immigrants | Italy | 5.0 /100 | #233 | Tragic 27.0% |
| Immigrants | Germany | 4.4 /100 | #234 | Tragic 27.0% |
| Immigrants | Morocco | 4.2 /100 | #235 | Tragic 27.0% |
| Cape Verdeans | 3.6 /100 | #236 | Tragic 26.9% |