Ukrainian vs American Currently Married
COMPARE
Ukrainian
American
Currently Married
Currently Married Comparison
Ukrainians
Americans
48.4%
CURRENTLY MARRIED
98.3/ 100
METRIC RATING
65th/ 347
METRIC RANK
48.0%
CURRENTLY MARRIED
95.7/ 100
METRIC RATING
90th/ 347
METRIC RANK
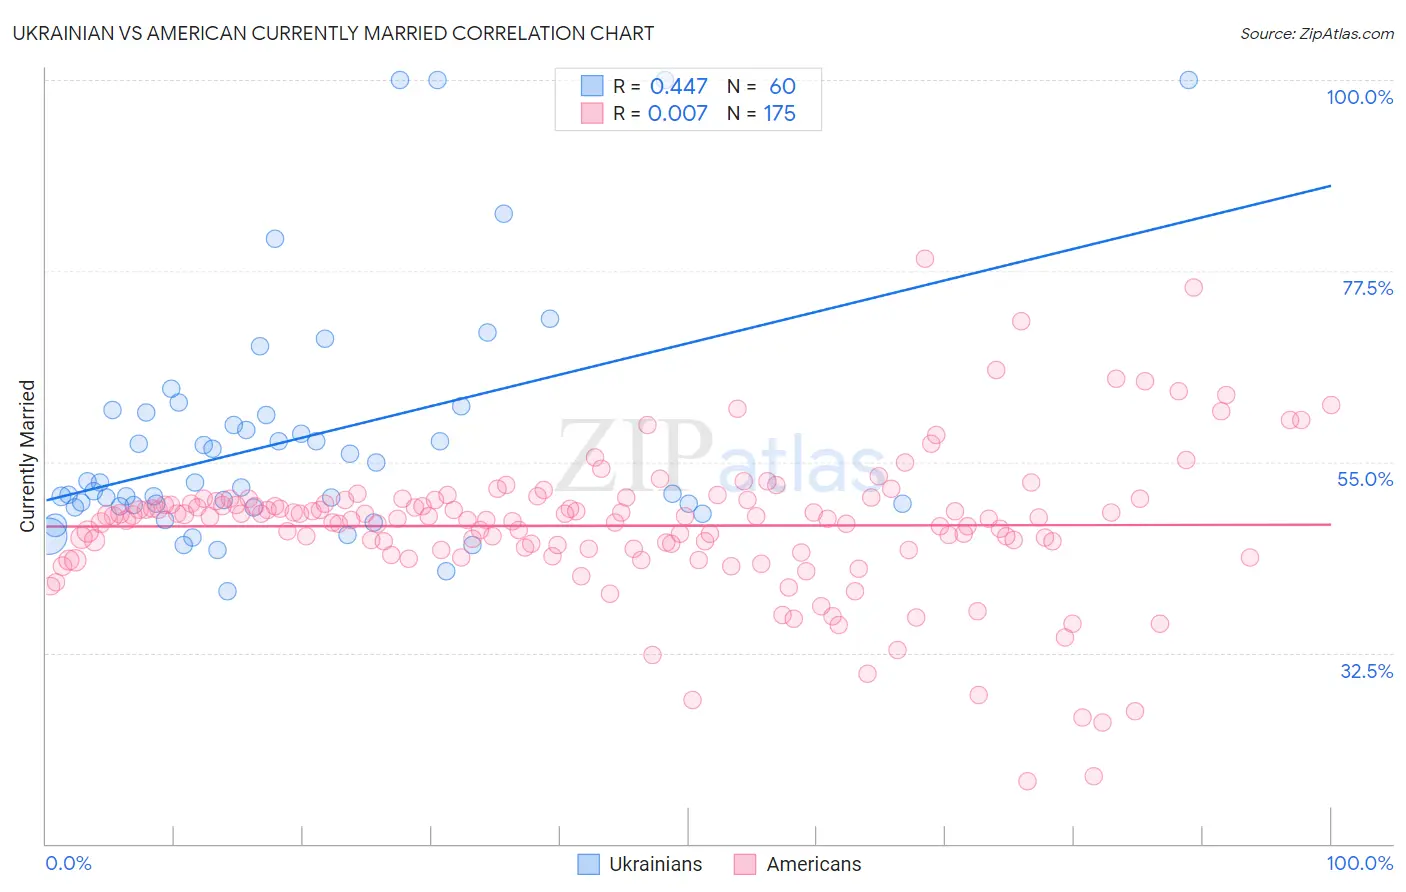
Ukrainian vs American Currently Married Correlation Chart
The statistical analysis conducted on geographies consisting of 448,616,463 people shows a moderate positive correlation between the proportion of Ukrainians and percentage of population currently married in the United States with a correlation coefficient (R) of 0.447 and weighted average of 48.4%. Similarly, the statistical analysis conducted on geographies consisting of 581,851,049 people shows no correlation between the proportion of Americans and percentage of population currently married in the United States with a correlation coefficient (R) of 0.007 and weighted average of 48.0%, a difference of 0.83%.
Currently Married Correlation Summary
| Measurement | Ukrainian | American |
| Minimum | 39.7% | 17.3% |
| Maximum | 100.0% | 79.0% |
| Range | 60.3% | 61.7% |
| Mean | 57.7% | 47.5% |
| Median | 52.3% | 48.4% |
| Interquartile 25% (IQ1) | 49.9% | 44.8% |
| Interquartile 75% (IQ3) | 60.7% | 50.5% |
| Interquartile Range (IQR) | 10.8% | 5.7% |
| Standard Deviation (Sample) | 14.2% | 8.5% |
| Standard Deviation (Population) | 14.1% | 8.5% |
Similar Demographics by Currently Married
Demographics Similar to Ukrainians by Currently Married
In terms of currently married, the demographic groups most similar to Ukrainians are Slavic (48.4%, a difference of 0.010%), Immigrants from Czechoslovakia (48.4%, a difference of 0.010%), Tongan (48.3%, a difference of 0.030%), Slovak (48.3%, a difference of 0.040%), and Immigrants from England (48.3%, a difference of 0.050%).
| Demographics | Rating | Rank | Currently Married |
| French | 98.6 /100 | #58 | Exceptional 48.4% |
| Immigrants | Ireland | 98.5 /100 | #59 | Exceptional 48.4% |
| Immigrants | Romania | 98.5 /100 | #60 | Exceptional 48.4% |
| Romanians | 98.5 /100 | #61 | Exceptional 48.4% |
| Asians | 98.5 /100 | #62 | Exceptional 48.4% |
| Slavs | 98.3 /100 | #63 | Exceptional 48.4% |
| Immigrants | Czechoslovakia | 98.3 /100 | #64 | Exceptional 48.4% |
| Ukrainians | 98.3 /100 | #65 | Exceptional 48.4% |
| Tongans | 98.2 /100 | #66 | Exceptional 48.3% |
| Slovaks | 98.2 /100 | #67 | Exceptional 48.3% |
| Immigrants | England | 98.2 /100 | #68 | Exceptional 48.3% |
| Canadians | 98.1 /100 | #69 | Exceptional 48.3% |
| Immigrants | Asia | 97.9 /100 | #70 | Exceptional 48.3% |
| Macedonians | 97.9 /100 | #71 | Exceptional 48.3% |
| Immigrants | Lebanon | 97.6 /100 | #72 | Exceptional 48.2% |
Demographics Similar to Americans by Currently Married
In terms of currently married, the demographic groups most similar to Americans are Indian (Asian) (48.0%, a difference of 0.020%), Immigrants from Bolivia (47.9%, a difference of 0.030%), Korean (47.9%, a difference of 0.070%), Immigrants from Eastern Europe (48.0%, a difference of 0.080%), and Jordanian (48.0%, a difference of 0.10%).
| Demographics | Rating | Rank | Currently Married |
| Bolivians | 96.9 /100 | #83 | Exceptional 48.1% |
| Immigrants | Israel | 96.9 /100 | #84 | Exceptional 48.1% |
| French Canadians | 96.3 /100 | #85 | Exceptional 48.0% |
| Immigrants | Japan | 96.2 /100 | #86 | Exceptional 48.0% |
| Jordanians | 96.2 /100 | #87 | Exceptional 48.0% |
| Immigrants | Eastern Europe | 96.1 /100 | #88 | Exceptional 48.0% |
| Indians (Asian) | 95.8 /100 | #89 | Exceptional 48.0% |
| Americans | 95.7 /100 | #90 | Exceptional 48.0% |
| Immigrants | Bolivia | 95.6 /100 | #91 | Exceptional 47.9% |
| Koreans | 95.4 /100 | #92 | Exceptional 47.9% |
| Lebanese | 95.1 /100 | #93 | Exceptional 47.9% |
| Native Hawaiians | 95.0 /100 | #94 | Exceptional 47.9% |
| Immigrants | Bulgaria | 94.8 /100 | #95 | Exceptional 47.9% |
| Egyptians | 94.8 /100 | #96 | Exceptional 47.9% |
| Immigrants | Ukraine | 94.8 /100 | #97 | Exceptional 47.9% |