Immigrants from Guatemala vs Immigrants from Sri Lanka Family Households
COMPARE
Immigrants from Guatemala
Immigrants from Sri Lanka
Family Households
Family Households Comparison
Immigrants from Guatemala
Immigrants from Sri Lanka
65.0%
FAMILY HOUSEHOLDS
96.9/ 100
METRIC RATING
109th/ 347
METRIC RANK
65.1%
FAMILY HOUSEHOLDS
98.0/ 100
METRIC RATING
102nd/ 347
METRIC RANK
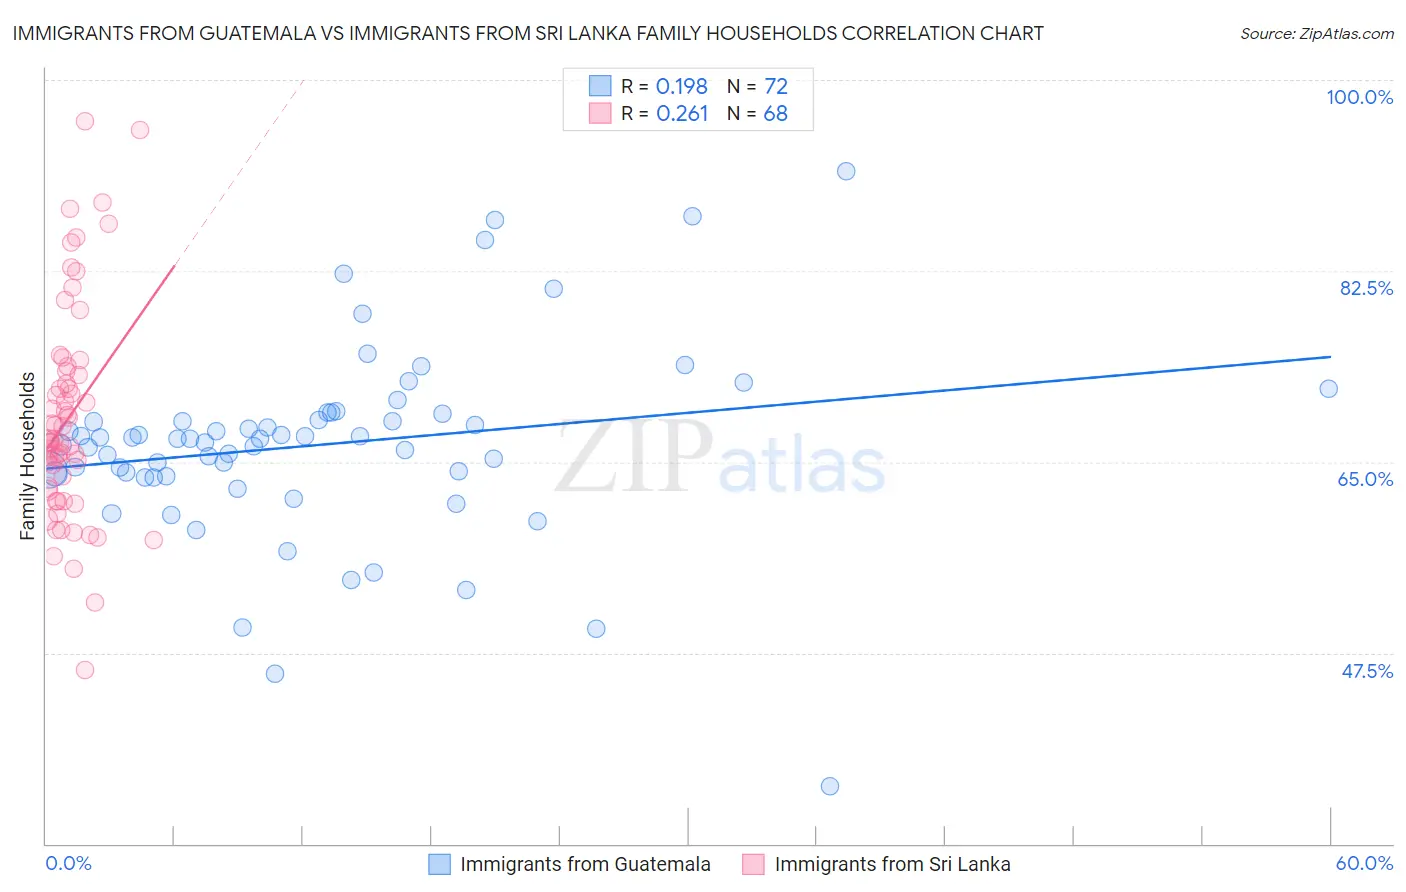
Immigrants from Guatemala vs Immigrants from Sri Lanka Family Households Correlation Chart
The statistical analysis conducted on geographies consisting of 377,174,620 people shows a poor positive correlation between the proportion of Immigrants from Guatemala and percentage of family households in the United States with a correlation coefficient (R) of 0.198 and weighted average of 65.0%. Similarly, the statistical analysis conducted on geographies consisting of 149,689,020 people shows a weak positive correlation between the proportion of Immigrants from Sri Lanka and percentage of family households in the United States with a correlation coefficient (R) of 0.261 and weighted average of 65.1%, a difference of 0.15%.
Family Households Correlation Summary
| Measurement | Immigrants from Guatemala | Immigrants from Sri Lanka |
| Minimum | 35.3% | 45.9% |
| Maximum | 91.7% | 96.3% |
| Range | 56.4% | 50.3% |
| Mean | 66.6% | 69.0% |
| Median | 67.1% | 67.0% |
| Interquartile 25% (IQ1) | 63.8% | 62.5% |
| Interquartile 75% (IQ3) | 69.1% | 73.1% |
| Interquartile Range (IQR) | 5.4% | 10.6% |
| Standard Deviation (Sample) | 8.9% | 9.9% |
| Standard Deviation (Population) | 8.9% | 9.8% |
Demographics Similar to Immigrants from Guatemala and Immigrants from Sri Lanka by Family Households
In terms of family households, the demographic groups most similar to Immigrants from Guatemala are Scandinavian (65.0%, a difference of 0.010%), European (65.0%, a difference of 0.010%), Palestinian (65.1%, a difference of 0.040%), White/Caucasian (65.1%, a difference of 0.050%), and Alaska Native (65.1%, a difference of 0.050%). Similarly, the demographic groups most similar to Immigrants from Sri Lanka are Haitian (65.2%, a difference of 0.020%), Chilean (65.2%, a difference of 0.020%), Indian (Asian) (65.1%, a difference of 0.020%), Spaniard (65.1%, a difference of 0.020%), and Central American Indian (65.2%, a difference of 0.060%).
| Demographics | Rating | Rank | Family Households |
| Immigrants | Portugal | 98.6 /100 | #95 | Exceptional 65.2% |
| Swiss | 98.6 /100 | #96 | Exceptional 65.2% |
| Guatemalans | 98.6 /100 | #97 | Exceptional 65.2% |
| Immigrants | Syria | 98.4 /100 | #98 | Exceptional 65.2% |
| Central American Indians | 98.3 /100 | #99 | Exceptional 65.2% |
| Haitians | 98.1 /100 | #100 | Exceptional 65.2% |
| Chileans | 98.1 /100 | #101 | Exceptional 65.2% |
| Immigrants | Sri Lanka | 98.0 /100 | #102 | Exceptional 65.1% |
| Indians (Asian) | 97.9 /100 | #103 | Exceptional 65.1% |
| Spaniards | 97.8 /100 | #104 | Exceptional 65.1% |
| English | 97.4 /100 | #105 | Exceptional 65.1% |
| Whites/Caucasians | 97.3 /100 | #106 | Exceptional 65.1% |
| Alaska Natives | 97.3 /100 | #107 | Exceptional 65.1% |
| Palestinians | 97.2 /100 | #108 | Exceptional 65.1% |
| Immigrants | Guatemala | 96.9 /100 | #109 | Exceptional 65.0% |
| Scandinavians | 96.8 /100 | #110 | Exceptional 65.0% |
| Europeans | 96.8 /100 | #111 | Exceptional 65.0% |
| Immigrants | Jordan | 96.5 /100 | #112 | Exceptional 65.0% |
| Spanish | 96.2 /100 | #113 | Exceptional 65.0% |
| Argentineans | 95.7 /100 | #114 | Exceptional 65.0% |
| Ecuadorians | 95.4 /100 | #115 | Exceptional 65.0% |