Turkish vs Immigrants from Cambodia Unemployment Among Ages 55 to 59 years
COMPARE
Turkish
Immigrants from Cambodia
Unemployment Among Ages 55 to 59 years
Unemployment Among Ages 55 to 59 years Comparison
Turks
Immigrants from Cambodia
4.7%
UNEMPLOYMENT AMONG AGES 55 TO 59 YEARS
90.9/ 100
METRIC RATING
116th/ 347
METRIC RANK
4.8%
UNEMPLOYMENT AMONG AGES 55 TO 59 YEARS
59.3/ 100
METRIC RATING
168th/ 347
METRIC RANK
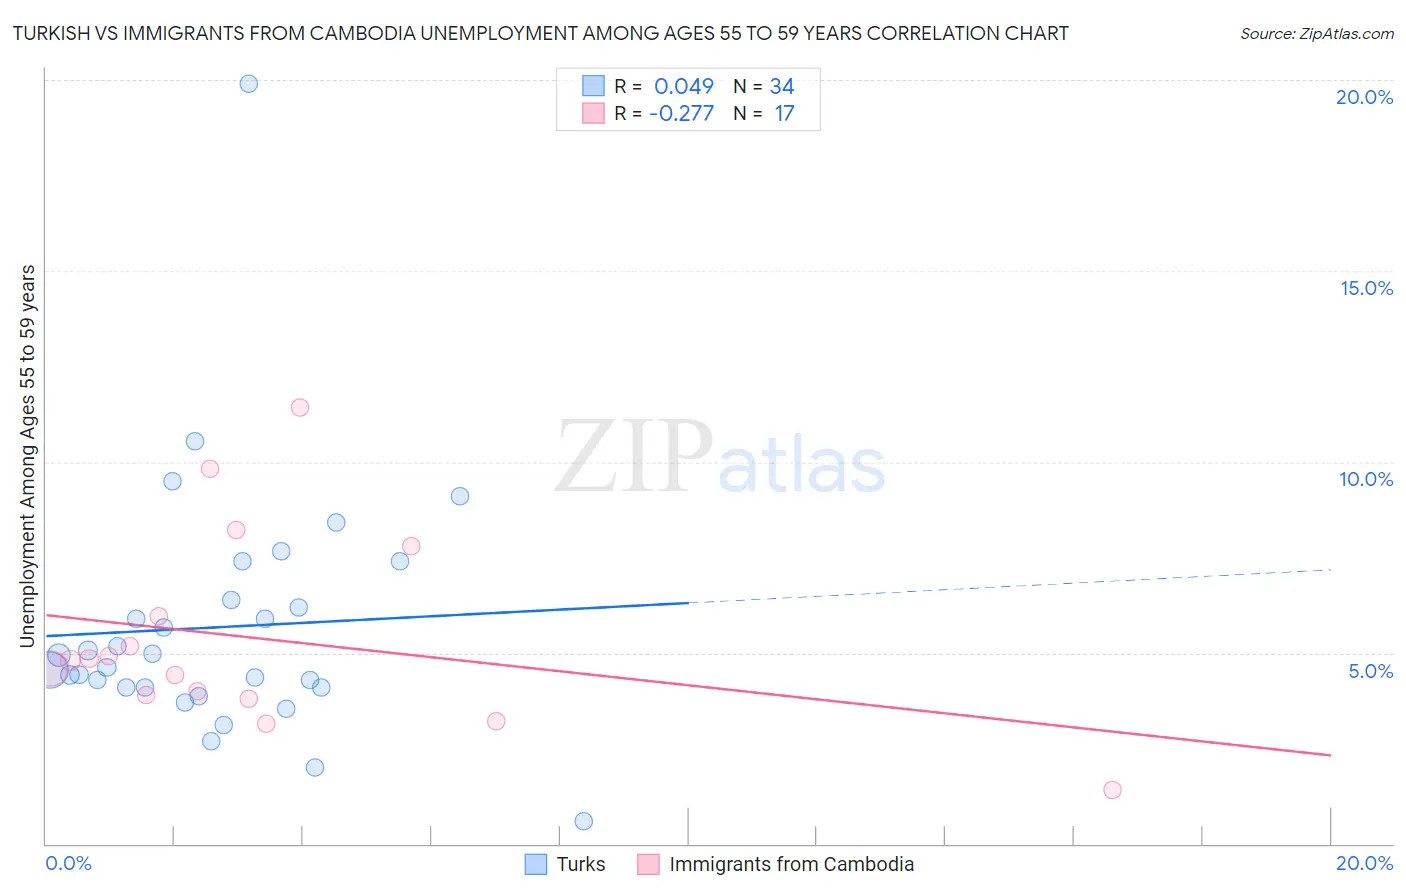
Turkish vs Immigrants from Cambodia Unemployment Among Ages 55 to 59 years Correlation Chart
The statistical analysis conducted on geographies consisting of 259,512,302 people shows no correlation between the proportion of Turks and unemployment rate among population between the ages 55 and 59 in the United States with a correlation coefficient (R) of 0.049 and weighted average of 4.7%. Similarly, the statistical analysis conducted on geographies consisting of 198,552,279 people shows a weak negative correlation between the proportion of Immigrants from Cambodia and unemployment rate among population between the ages 55 and 59 in the United States with a correlation coefficient (R) of -0.277 and weighted average of 4.8%, a difference of 2.0%.
Unemployment Among Ages 55 to 59 years Correlation Summary
| Measurement | Turkish | Immigrants from Cambodia |
| Minimum | 0.60% | 1.4% |
| Maximum | 19.9% | 11.4% |
| Range | 19.3% | 10.0% |
| Mean | 5.7% | 5.4% |
| Median | 4.8% | 4.8% |
| Interquartile 25% (IQ1) | 4.1% | 3.8% |
| Interquartile 75% (IQ3) | 6.4% | 6.9% |
| Interquartile Range (IQR) | 2.3% | 3.0% |
| Standard Deviation (Sample) | 3.3% | 2.6% |
| Standard Deviation (Population) | 3.2% | 2.5% |
Similar Demographics by Unemployment Among Ages 55 to 59 years
Demographics Similar to Turks by Unemployment Among Ages 55 to 59 years
In terms of unemployment among ages 55 to 59 years, the demographic groups most similar to Turks are South American Indian (4.7%, a difference of 0.0%), Asian (4.7%, a difference of 0.010%), Immigrants from Chile (4.7%, a difference of 0.020%), White/Caucasian (4.7%, a difference of 0.020%), and Bangladeshi (4.7%, a difference of 0.060%).
| Demographics | Rating | Rank | Unemployment Among Ages 55 to 59 years |
| Chileans | 93.2 /100 | #109 | Exceptional 4.7% |
| Egyptians | 92.9 /100 | #110 | Exceptional 4.7% |
| Austrians | 92.4 /100 | #111 | Exceptional 4.7% |
| Afghans | 92.1 /100 | #112 | Exceptional 4.7% |
| Immigrants | Spain | 91.4 /100 | #113 | Exceptional 4.7% |
| Bangladeshis | 91.3 /100 | #114 | Exceptional 4.7% |
| South American Indians | 90.9 /100 | #115 | Exceptional 4.7% |
| Turks | 90.9 /100 | #116 | Exceptional 4.7% |
| Asians | 90.8 /100 | #117 | Exceptional 4.7% |
| Immigrants | Chile | 90.7 /100 | #118 | Exceptional 4.7% |
| Whites/Caucasians | 90.7 /100 | #119 | Exceptional 4.7% |
| Immigrants | South Africa | 89.9 /100 | #120 | Excellent 4.7% |
| Pakistanis | 89.7 /100 | #121 | Excellent 4.7% |
| Immigrants | Afghanistan | 89.5 /100 | #122 | Excellent 4.7% |
| Immigrants | Japan | 89.4 /100 | #123 | Excellent 4.7% |
Demographics Similar to Immigrants from Cambodia by Unemployment Among Ages 55 to 59 years
In terms of unemployment among ages 55 to 59 years, the demographic groups most similar to Immigrants from Cambodia are Immigrants from Western Europe (4.8%, a difference of 0.040%), Immigrants from Sudan (4.8%, a difference of 0.040%), Potawatomi (4.8%, a difference of 0.11%), Immigrants from France (4.8%, a difference of 0.12%), and Uruguayan (4.8%, a difference of 0.15%).
| Demographics | Rating | Rank | Unemployment Among Ages 55 to 59 years |
| Koreans | 64.6 /100 | #161 | Good 4.8% |
| Immigrants | Africa | 64.2 /100 | #162 | Good 4.8% |
| Immigrants | Lebanon | 63.8 /100 | #163 | Good 4.8% |
| Americans | 63.3 /100 | #164 | Good 4.8% |
| Immigrants | France | 62.0 /100 | #165 | Good 4.8% |
| Potawatomi | 62.0 /100 | #166 | Good 4.8% |
| Immigrants | Western Europe | 60.4 /100 | #167 | Good 4.8% |
| Immigrants | Cambodia | 59.3 /100 | #168 | Average 4.8% |
| Immigrants | Sudan | 58.4 /100 | #169 | Average 4.8% |
| Uruguayans | 55.6 /100 | #170 | Average 4.8% |
| Japanese | 54.5 /100 | #171 | Average 4.8% |
| Nicaraguans | 54.0 /100 | #172 | Average 4.8% |
| Immigrants | Eastern Europe | 52.2 /100 | #173 | Average 4.8% |
| Immigrants | Croatia | 50.0 /100 | #174 | Average 4.8% |
| Australians | 48.6 /100 | #175 | Average 4.8% |