Immigrants from Uganda vs Burmese Births to Unmarried Women
COMPARE
Immigrants from Uganda
Burmese
Births to Unmarried Women
Births to Unmarried Women Comparison
Immigrants from Uganda
Burmese
30.5%
BIRTHS TO UNMARRIED WOMEN
82.6/ 100
METRIC RATING
143rd/ 347
METRIC RANK
26.4%
BIRTHS TO UNMARRIED WOMEN
99.9/ 100
METRIC RATING
22nd/ 347
METRIC RANK
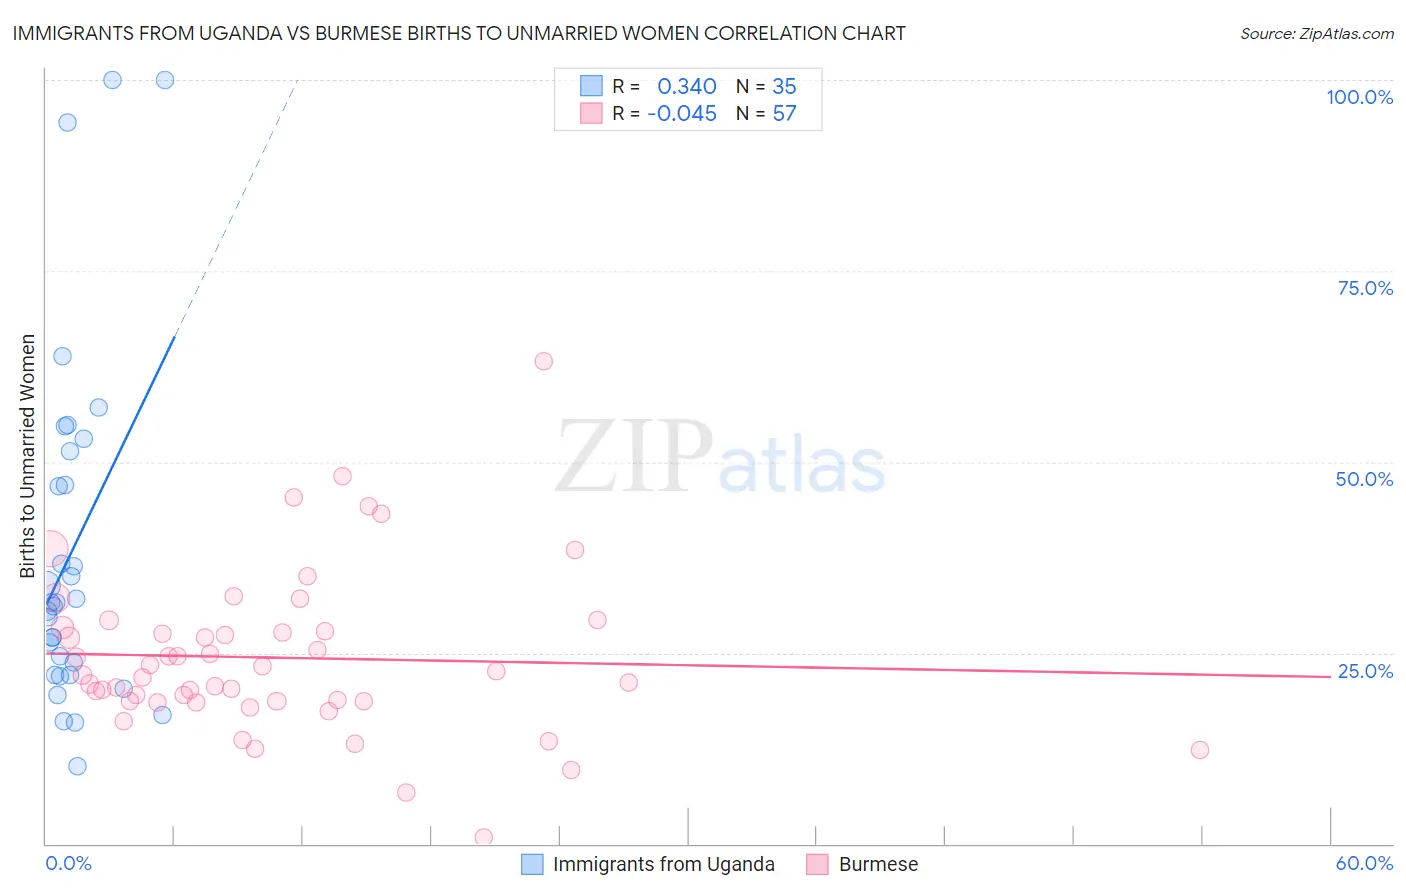
Immigrants from Uganda vs Burmese Births to Unmarried Women Correlation Chart
The statistical analysis conducted on geographies consisting of 123,239,709 people shows a mild positive correlation between the proportion of Immigrants from Uganda and percentage of births to unmarried women in the United States with a correlation coefficient (R) of 0.340 and weighted average of 30.5%. Similarly, the statistical analysis conducted on geographies consisting of 428,519,429 people shows no correlation between the proportion of Burmese and percentage of births to unmarried women in the United States with a correlation coefficient (R) of -0.045 and weighted average of 26.4%, a difference of 15.7%.
Births to Unmarried Women Correlation Summary
| Measurement | Immigrants from Uganda | Burmese |
| Minimum | 10.2% | 0.80% |
| Maximum | 100.0% | 63.1% |
| Range | 89.8% | 62.3% |
| Mean | 38.4% | 24.4% |
| Median | 31.6% | 22.1% |
| Interquartile 25% (IQ1) | 22.1% | 18.7% |
| Interquartile 75% (IQ3) | 51.4% | 28.1% |
| Interquartile Range (IQR) | 29.3% | 9.4% |
| Standard Deviation (Sample) | 22.8% | 10.7% |
| Standard Deviation (Population) | 22.5% | 10.6% |
Similar Demographics by Births to Unmarried Women
Demographics Similar to Immigrants from Uganda by Births to Unmarried Women
In terms of births to unmarried women, the demographic groups most similar to Immigrants from Uganda are South African (30.5%, a difference of 0.020%), Czech (30.5%, a difference of 0.070%), Pakistani (30.5%, a difference of 0.080%), Swiss (30.5%, a difference of 0.10%), and Immigrants from North America (30.6%, a difference of 0.17%).
| Demographics | Rating | Rank | Births to Unmarried Women |
| Immigrants | Scotland | 84.6 /100 | #136 | Excellent 30.4% |
| Immigrants | Philippines | 83.9 /100 | #137 | Excellent 30.4% |
| Puget Sound Salish | 83.9 /100 | #138 | Excellent 30.4% |
| Immigrants | Canada | 83.7 /100 | #139 | Excellent 30.4% |
| Swiss | 83.1 /100 | #140 | Excellent 30.5% |
| Pakistanis | 83.0 /100 | #141 | Excellent 30.5% |
| South Africans | 82.7 /100 | #142 | Excellent 30.5% |
| Immigrants | Uganda | 82.6 /100 | #143 | Excellent 30.5% |
| Czechs | 82.1 /100 | #144 | Excellent 30.5% |
| Immigrants | North America | 81.5 /100 | #145 | Excellent 30.6% |
| Northern Europeans | 81.4 /100 | #146 | Excellent 30.6% |
| Immigrants | Oceania | 81.2 /100 | #147 | Excellent 30.6% |
| Chileans | 79.1 /100 | #148 | Good 30.7% |
| Serbians | 78.8 /100 | #149 | Good 30.7% |
| Somalis | 77.8 /100 | #150 | Good 30.7% |
Demographics Similar to Burmese by Births to Unmarried Women
In terms of births to unmarried women, the demographic groups most similar to Burmese are Immigrants from Japan (26.4%, a difference of 0.19%), Soviet Union (26.3%, a difference of 0.22%), Immigrants from Korea (26.3%, a difference of 0.36%), Armenian (26.2%, a difference of 0.57%), and Immigrants from Australia (26.6%, a difference of 0.98%).
| Demographics | Rating | Rank | Births to Unmarried Women |
| Immigrants | Singapore | 100.0 /100 | #15 | Exceptional 25.6% |
| Immigrants | Belarus | 100.0 /100 | #16 | Exceptional 25.6% |
| Immigrants | Uzbekistan | 100.0 /100 | #17 | Exceptional 25.8% |
| Immigrants | Armenia | 99.9 /100 | #18 | Exceptional 26.1% |
| Armenians | 99.9 /100 | #19 | Exceptional 26.2% |
| Immigrants | Korea | 99.9 /100 | #20 | Exceptional 26.3% |
| Soviet Union | 99.9 /100 | #21 | Exceptional 26.3% |
| Burmese | 99.9 /100 | #22 | Exceptional 26.4% |
| Immigrants | Japan | 99.9 /100 | #23 | Exceptional 26.4% |
| Immigrants | Australia | 99.9 /100 | #24 | Exceptional 26.6% |
| Cambodians | 99.9 /100 | #25 | Exceptional 26.7% |
| Asians | 99.9 /100 | #26 | Exceptional 26.8% |
| Immigrants | Asia | 99.9 /100 | #27 | Exceptional 26.8% |
| Okinawans | 99.8 /100 | #28 | Exceptional 26.9% |
| Cypriots | 99.8 /100 | #29 | Exceptional 27.0% |