Tsimshian vs English Single Father Households
COMPARE
Tsimshian
English
Single Father Households
Single Father Households Comparison
Tsimshian
English
2.9%
SINGLE FATHER HOUSEHOLDS
0.0/ 100
METRIC RATING
312th/ 347
METRIC RANK
2.3%
SINGLE FATHER HOUSEHOLDS
68.6/ 100
METRIC RATING
166th/ 347
METRIC RANK
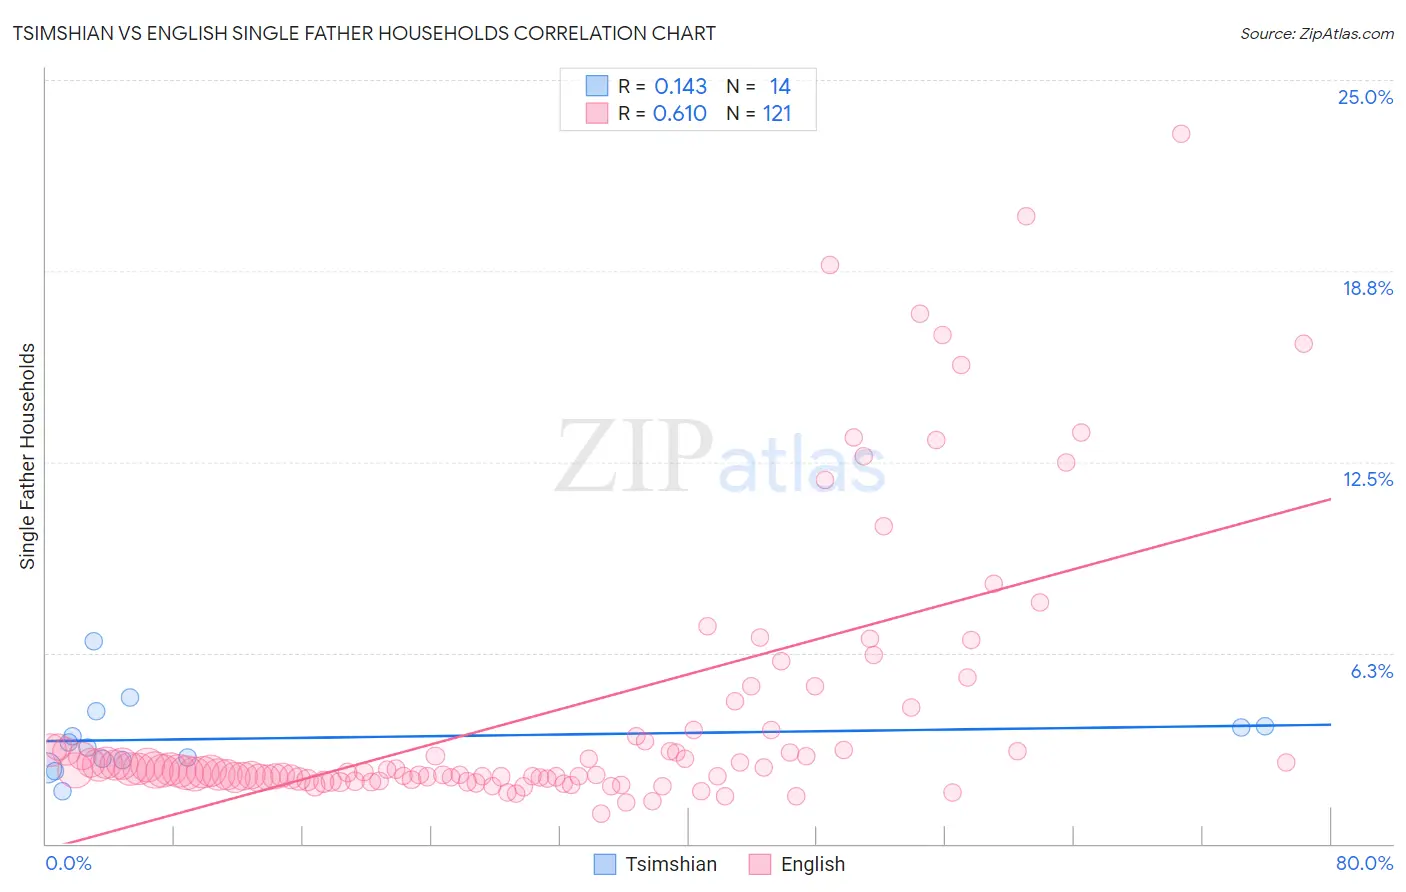
Tsimshian vs English Single Father Households Correlation Chart
The statistical analysis conducted on geographies consisting of 15,613,275 people shows a poor positive correlation between the proportion of Tsimshian and percentage of single father households in the United States with a correlation coefficient (R) of 0.143 and weighted average of 2.9%. Similarly, the statistical analysis conducted on geographies consisting of 561,704,434 people shows a significant positive correlation between the proportion of English and percentage of single father households in the United States with a correlation coefficient (R) of 0.610 and weighted average of 2.3%, a difference of 25.4%.
Single Father Households Correlation Summary
| Measurement | Tsimshian | English |
| Minimum | 1.7% | 0.99% |
| Maximum | 6.6% | 23.3% |
| Range | 4.9% | 22.3% |
| Mean | 3.5% | 4.3% |
| Median | 3.2% | 2.4% |
| Interquartile 25% (IQ1) | 2.7% | 2.2% |
| Interquartile 75% (IQ3) | 3.8% | 3.4% |
| Interquartile Range (IQR) | 1.1% | 1.3% |
| Standard Deviation (Sample) | 1.2% | 4.4% |
| Standard Deviation (Population) | 1.2% | 4.4% |
Similar Demographics by Single Father Households
Demographics Similar to Tsimshian by Single Father Households
In terms of single father households, the demographic groups most similar to Tsimshian are Arapaho (2.9%, a difference of 0.42%), Spanish American Indian (2.9%, a difference of 0.57%), Salvadoran (2.9%, a difference of 0.67%), Immigrants from Laos (2.9%, a difference of 1.1%), and Cheyenne (2.9%, a difference of 1.1%).
| Demographics | Rating | Rank | Single Father Households |
| Hispanics or Latinos | 0.0 /100 | #305 | Tragic 2.8% |
| Immigrants | Azores | 0.0 /100 | #306 | Tragic 2.8% |
| Hopi | 0.0 /100 | #307 | Tragic 2.8% |
| Apache | 0.0 /100 | #308 | Tragic 2.8% |
| Central Americans | 0.0 /100 | #309 | Tragic 2.9% |
| Immigrants | Laos | 0.0 /100 | #310 | Tragic 2.9% |
| Spanish American Indians | 0.0 /100 | #311 | Tragic 2.9% |
| Tsimshian | 0.0 /100 | #312 | Tragic 2.9% |
| Arapaho | 0.0 /100 | #313 | Tragic 2.9% |
| Salvadorans | 0.0 /100 | #314 | Tragic 2.9% |
| Cheyenne | 0.0 /100 | #315 | Tragic 2.9% |
| Houma | 0.0 /100 | #316 | Tragic 2.9% |
| Immigrants | El Salvador | 0.0 /100 | #317 | Tragic 2.9% |
| Cape Verdeans | 0.0 /100 | #318 | Tragic 2.9% |
| Ute | 0.0 /100 | #319 | Tragic 3.0% |
Demographics Similar to English by Single Father Households
In terms of single father households, the demographic groups most similar to English are Scotch-Irish (2.3%, a difference of 0.070%), Pakistani (2.3%, a difference of 0.17%), Irish (2.3%, a difference of 0.31%), South American (2.3%, a difference of 0.36%), and Scottish (2.3%, a difference of 0.38%).
| Demographics | Rating | Rank | Single Father Households |
| Immigrants | West Indies | 77.9 /100 | #159 | Good 2.3% |
| Immigrants | Bolivia | 76.3 /100 | #160 | Good 2.3% |
| Swiss | 73.2 /100 | #161 | Good 2.3% |
| Scottish | 72.8 /100 | #162 | Good 2.3% |
| Irish | 72.1 /100 | #163 | Good 2.3% |
| Pakistanis | 70.6 /100 | #164 | Good 2.3% |
| Scotch-Irish | 69.4 /100 | #165 | Good 2.3% |
| English | 68.6 /100 | #166 | Good 2.3% |
| South Americans | 64.3 /100 | #167 | Good 2.3% |
| Icelanders | 63.1 /100 | #168 | Good 2.3% |
| Czechs | 62.5 /100 | #169 | Good 2.3% |
| Ugandans | 62.2 /100 | #170 | Good 2.3% |
| Swedes | 61.6 /100 | #171 | Good 2.3% |
| Czechoslovakians | 58.9 /100 | #172 | Average 2.3% |
| Celtics | 55.4 /100 | #173 | Average 2.3% |