Tsimshian vs Venezuelan Single Father Households
COMPARE
Tsimshian
Venezuelan
Single Father Households
Single Father Households Comparison
Tsimshian
Venezuelans
2.9%
SINGLE FATHER HOUSEHOLDS
0.0/ 100
METRIC RATING
312th/ 347
METRIC RANK
2.3%
SINGLE FATHER HOUSEHOLDS
86.2/ 100
METRIC RATING
150th/ 347
METRIC RANK
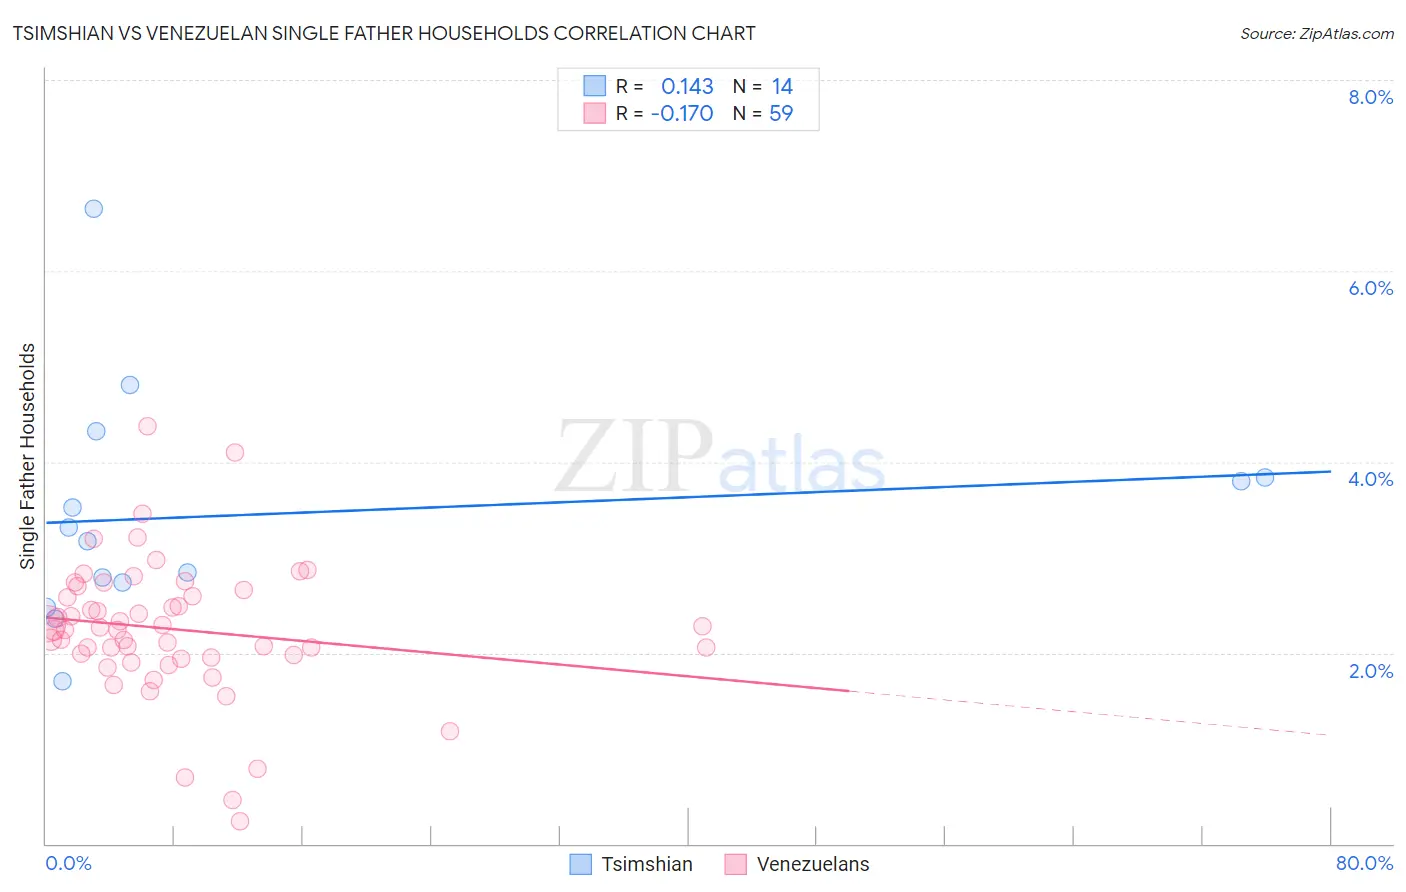
Tsimshian vs Venezuelan Single Father Households Correlation Chart
The statistical analysis conducted on geographies consisting of 15,613,275 people shows a poor positive correlation between the proportion of Tsimshian and percentage of single father households in the United States with a correlation coefficient (R) of 0.143 and weighted average of 2.9%. Similarly, the statistical analysis conducted on geographies consisting of 304,547,521 people shows a poor negative correlation between the proportion of Venezuelans and percentage of single father households in the United States with a correlation coefficient (R) of -0.170 and weighted average of 2.3%, a difference of 27.9%.
Single Father Households Correlation Summary
| Measurement | Tsimshian | Venezuelan |
| Minimum | 1.7% | 0.23% |
| Maximum | 6.6% | 4.4% |
| Range | 4.9% | 4.1% |
| Mean | 3.5% | 2.2% |
| Median | 3.2% | 2.2% |
| Interquartile 25% (IQ1) | 2.7% | 1.9% |
| Interquartile 75% (IQ3) | 3.8% | 2.7% |
| Interquartile Range (IQR) | 1.1% | 0.71% |
| Standard Deviation (Sample) | 1.2% | 0.73% |
| Standard Deviation (Population) | 1.2% | 0.72% |
Similar Demographics by Single Father Households
Demographics Similar to Tsimshian by Single Father Households
In terms of single father households, the demographic groups most similar to Tsimshian are Arapaho (2.9%, a difference of 0.42%), Spanish American Indian (2.9%, a difference of 0.57%), Salvadoran (2.9%, a difference of 0.67%), Immigrants from Laos (2.9%, a difference of 1.1%), and Cheyenne (2.9%, a difference of 1.1%).
| Demographics | Rating | Rank | Single Father Households |
| Hispanics or Latinos | 0.0 /100 | #305 | Tragic 2.8% |
| Immigrants | Azores | 0.0 /100 | #306 | Tragic 2.8% |
| Hopi | 0.0 /100 | #307 | Tragic 2.8% |
| Apache | 0.0 /100 | #308 | Tragic 2.8% |
| Central Americans | 0.0 /100 | #309 | Tragic 2.9% |
| Immigrants | Laos | 0.0 /100 | #310 | Tragic 2.9% |
| Spanish American Indians | 0.0 /100 | #311 | Tragic 2.9% |
| Tsimshian | 0.0 /100 | #312 | Tragic 2.9% |
| Arapaho | 0.0 /100 | #313 | Tragic 2.9% |
| Salvadorans | 0.0 /100 | #314 | Tragic 2.9% |
| Cheyenne | 0.0 /100 | #315 | Tragic 2.9% |
| Houma | 0.0 /100 | #316 | Tragic 2.9% |
| Immigrants | El Salvador | 0.0 /100 | #317 | Tragic 2.9% |
| Cape Verdeans | 0.0 /100 | #318 | Tragic 2.9% |
| Ute | 0.0 /100 | #319 | Tragic 3.0% |
Demographics Similar to Venezuelans by Single Father Households
In terms of single father households, the demographic groups most similar to Venezuelans are Immigrants from Syria (2.3%, a difference of 0.21%), Senegalese (2.3%, a difference of 0.38%), South American Indian (2.3%, a difference of 0.39%), Immigrants from Venezuela (2.3%, a difference of 0.44%), and Slavic (2.2%, a difference of 0.49%).
| Demographics | Rating | Rank | Single Father Households |
| Immigrants | Nepal | 92.1 /100 | #143 | Exceptional 2.2% |
| Slovaks | 90.7 /100 | #144 | Exceptional 2.2% |
| Immigrants | Zimbabwe | 90.2 /100 | #145 | Exceptional 2.2% |
| Northern Europeans | 89.8 /100 | #146 | Excellent 2.2% |
| Slavs | 88.9 /100 | #147 | Excellent 2.2% |
| South American Indians | 88.5 /100 | #148 | Excellent 2.3% |
| Senegalese | 88.4 /100 | #149 | Excellent 2.3% |
| Venezuelans | 86.2 /100 | #150 | Excellent 2.3% |
| Immigrants | Syria | 84.8 /100 | #151 | Excellent 2.3% |
| Immigrants | Venezuela | 83.2 /100 | #152 | Excellent 2.3% |
| Immigrants | Germany | 82.8 /100 | #153 | Excellent 2.3% |
| Bolivians | 81.0 /100 | #154 | Excellent 2.3% |
| Europeans | 80.9 /100 | #155 | Excellent 2.3% |
| Immigrants | South America | 79.9 /100 | #156 | Good 2.3% |
| Canadians | 79.7 /100 | #157 | Good 2.3% |