Tsimshian vs Spanish American Indian Divorced or Separated
COMPARE
Tsimshian
Spanish American Indian
Divorced or Separated
Divorced or Separated Comparison
Tsimshian
Spanish American Indians
13.3%
DIVORCED OR SEPARATED
0.0/ 100
METRIC RATING
316th/ 347
METRIC RANK
11.6%
DIVORCED OR SEPARATED
99.0/ 100
METRIC RATING
91st/ 347
METRIC RANK
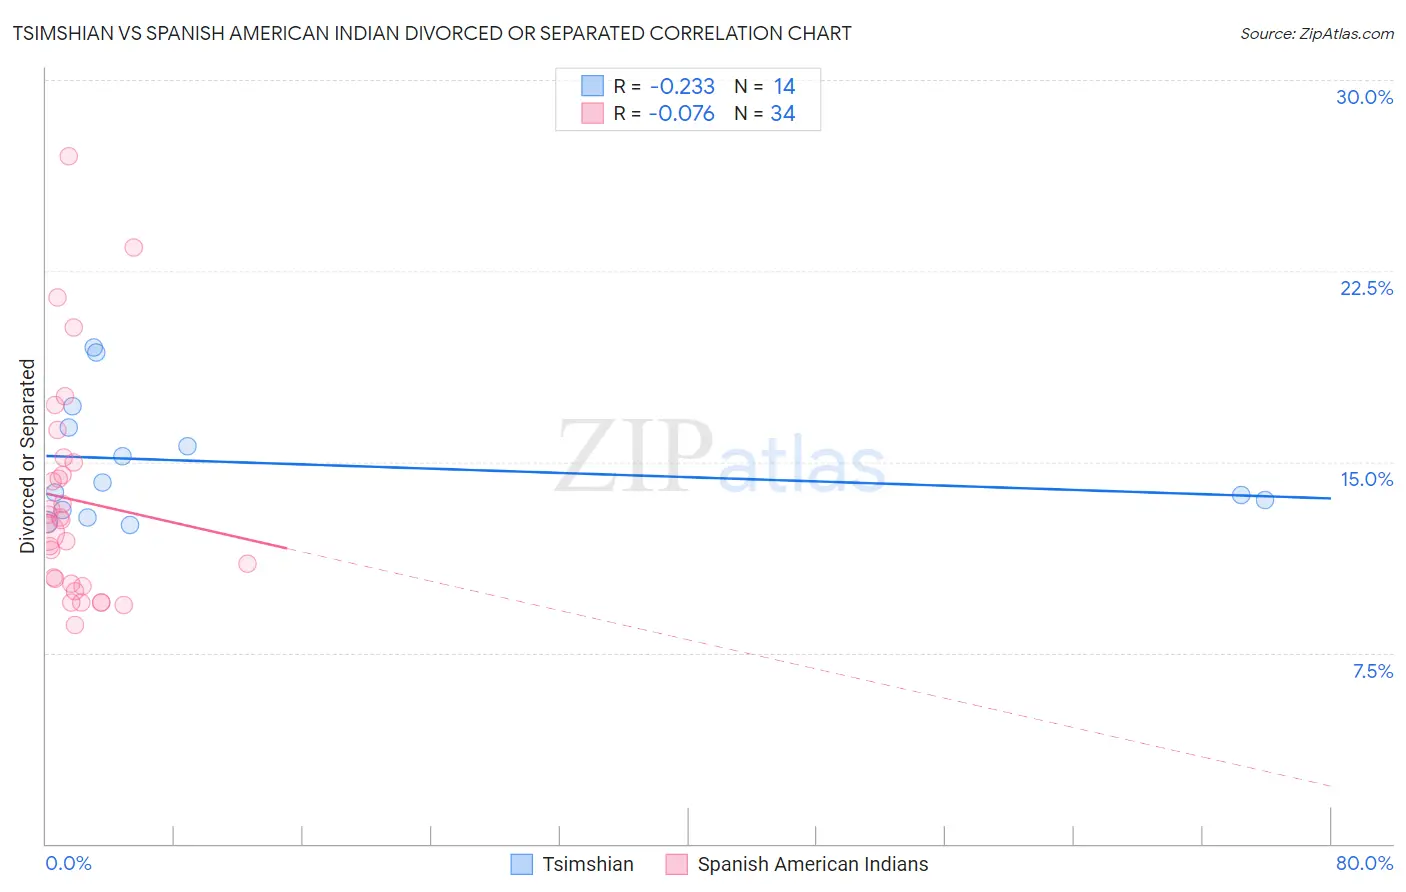
Tsimshian vs Spanish American Indian Divorced or Separated Correlation Chart
The statistical analysis conducted on geographies consisting of 15,626,183 people shows a weak negative correlation between the proportion of Tsimshian and percentage of population currently divorced or separated in the United States with a correlation coefficient (R) of -0.233 and weighted average of 13.3%. Similarly, the statistical analysis conducted on geographies consisting of 73,145,304 people shows a slight negative correlation between the proportion of Spanish American Indians and percentage of population currently divorced or separated in the United States with a correlation coefficient (R) of -0.076 and weighted average of 11.6%, a difference of 15.3%.
Divorced or Separated Correlation Summary
| Measurement | Tsimshian | Spanish American Indian |
| Minimum | 12.5% | 8.6% |
| Maximum | 19.5% | 27.0% |
| Range | 7.0% | 18.4% |
| Mean | 15.0% | 13.5% |
| Median | 14.0% | 12.6% |
| Interquartile 25% (IQ1) | 13.1% | 10.2% |
| Interquartile 75% (IQ3) | 16.3% | 15.0% |
| Interquartile Range (IQR) | 3.2% | 4.8% |
| Standard Deviation (Sample) | 2.4% | 4.3% |
| Standard Deviation (Population) | 2.3% | 4.3% |
Similar Demographics by Divorced or Separated
Demographics Similar to Tsimshian by Divorced or Separated
In terms of divorced or separated, the demographic groups most similar to Tsimshian are Haitian (13.3%, a difference of 0.020%), Spanish American (13.3%, a difference of 0.030%), Cree (13.4%, a difference of 0.050%), Puget Sound Salish (13.4%, a difference of 0.080%), and Cajun (13.4%, a difference of 0.14%).
| Demographics | Rating | Rank | Divorced or Separated |
| Americans | 0.0 /100 | #309 | Tragic 13.2% |
| Africans | 0.0 /100 | #310 | Tragic 13.2% |
| Sioux | 0.0 /100 | #311 | Tragic 13.2% |
| Blackfeet | 0.0 /100 | #312 | Tragic 13.3% |
| Immigrants | Nicaragua | 0.0 /100 | #313 | Tragic 13.3% |
| Yaqui | 0.0 /100 | #314 | Tragic 13.3% |
| Spanish Americans | 0.0 /100 | #315 | Tragic 13.3% |
| Tsimshian | 0.0 /100 | #316 | Tragic 13.3% |
| Haitians | 0.0 /100 | #317 | Tragic 13.3% |
| Cree | 0.0 /100 | #318 | Tragic 13.4% |
| Puget Sound Salish | 0.0 /100 | #319 | Tragic 13.4% |
| Cajuns | 0.0 /100 | #320 | Tragic 13.4% |
| Cheyenne | 0.0 /100 | #321 | Tragic 13.4% |
| Immigrants | Haiti | 0.0 /100 | #322 | Tragic 13.4% |
| U.S. Virgin Islanders | 0.0 /100 | #323 | Tragic 13.4% |
Demographics Similar to Spanish American Indians by Divorced or Separated
In terms of divorced or separated, the demographic groups most similar to Spanish American Indians are Zimbabwean (11.6%, a difference of 0.040%), Immigrants from Denmark (11.6%, a difference of 0.060%), Arab (11.6%, a difference of 0.060%), Immigrants from Fiji (11.6%, a difference of 0.070%), and Immigrants from Southern Europe (11.6%, a difference of 0.14%).
| Demographics | Rating | Rank | Divorced or Separated |
| Bulgarians | 99.3 /100 | #84 | Exceptional 11.5% |
| Immigrants | Albania | 99.3 /100 | #85 | Exceptional 11.5% |
| Immigrants | Latvia | 99.2 /100 | #86 | Exceptional 11.6% |
| Immigrants | Nepal | 99.2 /100 | #87 | Exceptional 11.6% |
| Immigrants | Europe | 99.2 /100 | #88 | Exceptional 11.6% |
| Immigrants | Southern Europe | 99.1 /100 | #89 | Exceptional 11.6% |
| Zimbabweans | 99.0 /100 | #90 | Exceptional 11.6% |
| Spanish American Indians | 99.0 /100 | #91 | Exceptional 11.6% |
| Immigrants | Denmark | 98.9 /100 | #92 | Exceptional 11.6% |
| Arabs | 98.9 /100 | #93 | Exceptional 11.6% |
| Immigrants | Fiji | 98.9 /100 | #94 | Exceptional 11.6% |
| Immigrants | Serbia | 98.8 /100 | #95 | Exceptional 11.6% |
| Immigrants | Ukraine | 98.7 /100 | #96 | Exceptional 11.6% |
| Latvians | 98.7 /100 | #97 | Exceptional 11.6% |
| Immigrants | Jordan | 98.6 /100 | #98 | Exceptional 11.6% |