Swiss vs Mongolian Family Households with Children
COMPARE
Swiss
Mongolian
Family Households with Children
Family Households with Children Comparison
Swiss
Mongolians
27.7%
FAMILY HOUSEHOLDS WITH CHILDREN
81.4/ 100
METRIC RATING
142nd/ 347
METRIC RANK
27.6%
FAMILY HOUSEHOLDS WITH CHILDREN
70.7/ 100
METRIC RATING
159th/ 347
METRIC RANK
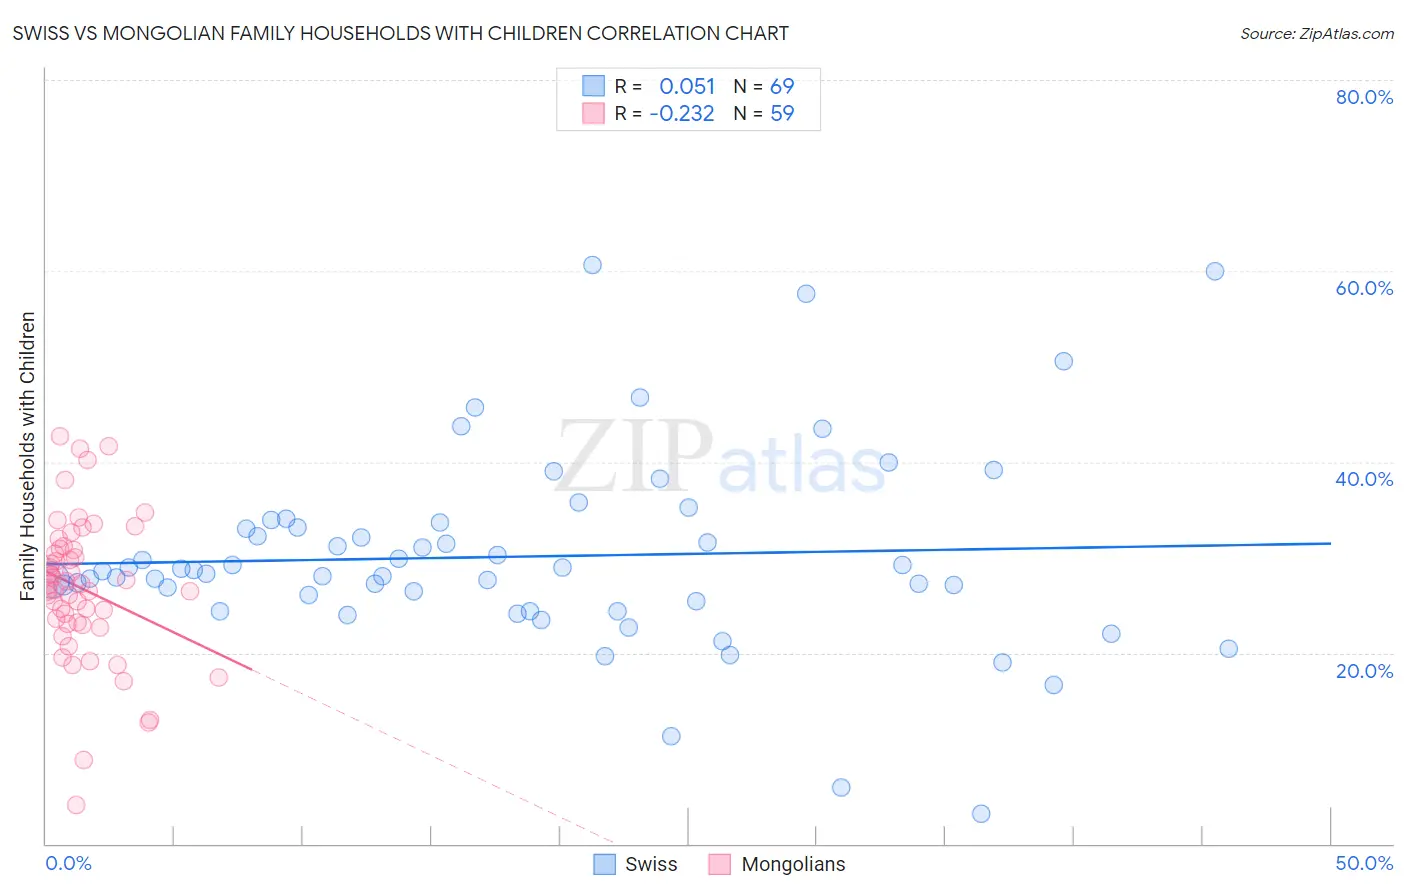
Swiss vs Mongolian Family Households with Children Correlation Chart
The statistical analysis conducted on geographies consisting of 464,540,276 people shows a slight positive correlation between the proportion of Swiss and percentage of family households with children in the United States with a correlation coefficient (R) of 0.051 and weighted average of 27.7%. Similarly, the statistical analysis conducted on geographies consisting of 140,279,389 people shows a weak negative correlation between the proportion of Mongolians and percentage of family households with children in the United States with a correlation coefficient (R) of -0.232 and weighted average of 27.6%, a difference of 0.32%.
Family Households with Children Correlation Summary
| Measurement | Swiss | Mongolian |
| Minimum | 3.1% | 4.0% |
| Maximum | 60.6% | 42.6% |
| Range | 57.5% | 38.6% |
| Mean | 30.1% | 26.7% |
| Median | 28.5% | 27.2% |
| Interquartile 25% (IQ1) | 24.9% | 23.0% |
| Interquartile 75% (IQ3) | 33.4% | 30.8% |
| Interquartile Range (IQR) | 8.6% | 7.8% |
| Standard Deviation (Sample) | 10.3% | 7.5% |
| Standard Deviation (Population) | 10.2% | 7.5% |
Demographics Similar to Swiss and Mongolians by Family Households with Children
In terms of family households with children, the demographic groups most similar to Swiss are Immigrants from Eastern Asia (27.7%, a difference of 0.010%), Spanish (27.7%, a difference of 0.020%), Immigrants from Eastern Africa (27.7%, a difference of 0.040%), Brazilian (27.7%, a difference of 0.060%), and Immigrants from Chile (27.7%, a difference of 0.070%). Similarly, the demographic groups most similar to Mongolians are Romanian (27.6%, a difference of 0.0%), Indian (Asian) (27.6%, a difference of 0.020%), Subsaharan African (27.6%, a difference of 0.080%), Comanche (27.6%, a difference of 0.11%), and Hungarian (27.6%, a difference of 0.11%).
| Demographics | Rating | Rank | Family Households with Children |
| Spanish | 81.8 /100 | #140 | Excellent 27.7% |
| Immigrants | Eastern Asia | 81.7 /100 | #141 | Excellent 27.7% |
| Swiss | 81.4 /100 | #142 | Excellent 27.7% |
| Immigrants | Eastern Africa | 80.2 /100 | #143 | Excellent 27.7% |
| Brazilians | 79.6 /100 | #144 | Good 27.7% |
| Immigrants | Chile | 79.5 /100 | #145 | Good 27.7% |
| Basques | 79.5 /100 | #146 | Good 27.7% |
| Immigrants | Moldova | 79.1 /100 | #147 | Good 27.6% |
| Osage | 79.0 /100 | #148 | Good 27.6% |
| Menominee | 78.9 /100 | #149 | Good 27.6% |
| Argentineans | 78.5 /100 | #150 | Good 27.6% |
| Portuguese | 77.8 /100 | #151 | Good 27.6% |
| Ethiopians | 77.0 /100 | #152 | Good 27.6% |
| Immigrants | Cabo Verde | 75.6 /100 | #153 | Good 27.6% |
| Icelanders | 75.3 /100 | #154 | Good 27.6% |
| Comanche | 74.8 /100 | #155 | Good 27.6% |
| Hungarians | 74.6 /100 | #156 | Good 27.6% |
| Indians (Asian) | 71.6 /100 | #157 | Good 27.6% |
| Romanians | 70.8 /100 | #158 | Good 27.6% |
| Mongolians | 70.7 /100 | #159 | Good 27.6% |
| Sub-Saharan Africans | 67.5 /100 | #160 | Good 27.6% |