Immigrants from the Azores vs Mongolian Family Households with Children
COMPARE
Immigrants from the Azores
Mongolian
Family Households with Children
Family Households with Children Comparison
Immigrants from the Azores
Mongolians
28.1%
FAMILY HOUSEHOLDS WITH CHILDREN
98.8/ 100
METRIC RATING
99th/ 347
METRIC RANK
27.6%
FAMILY HOUSEHOLDS WITH CHILDREN
70.7/ 100
METRIC RATING
159th/ 347
METRIC RANK
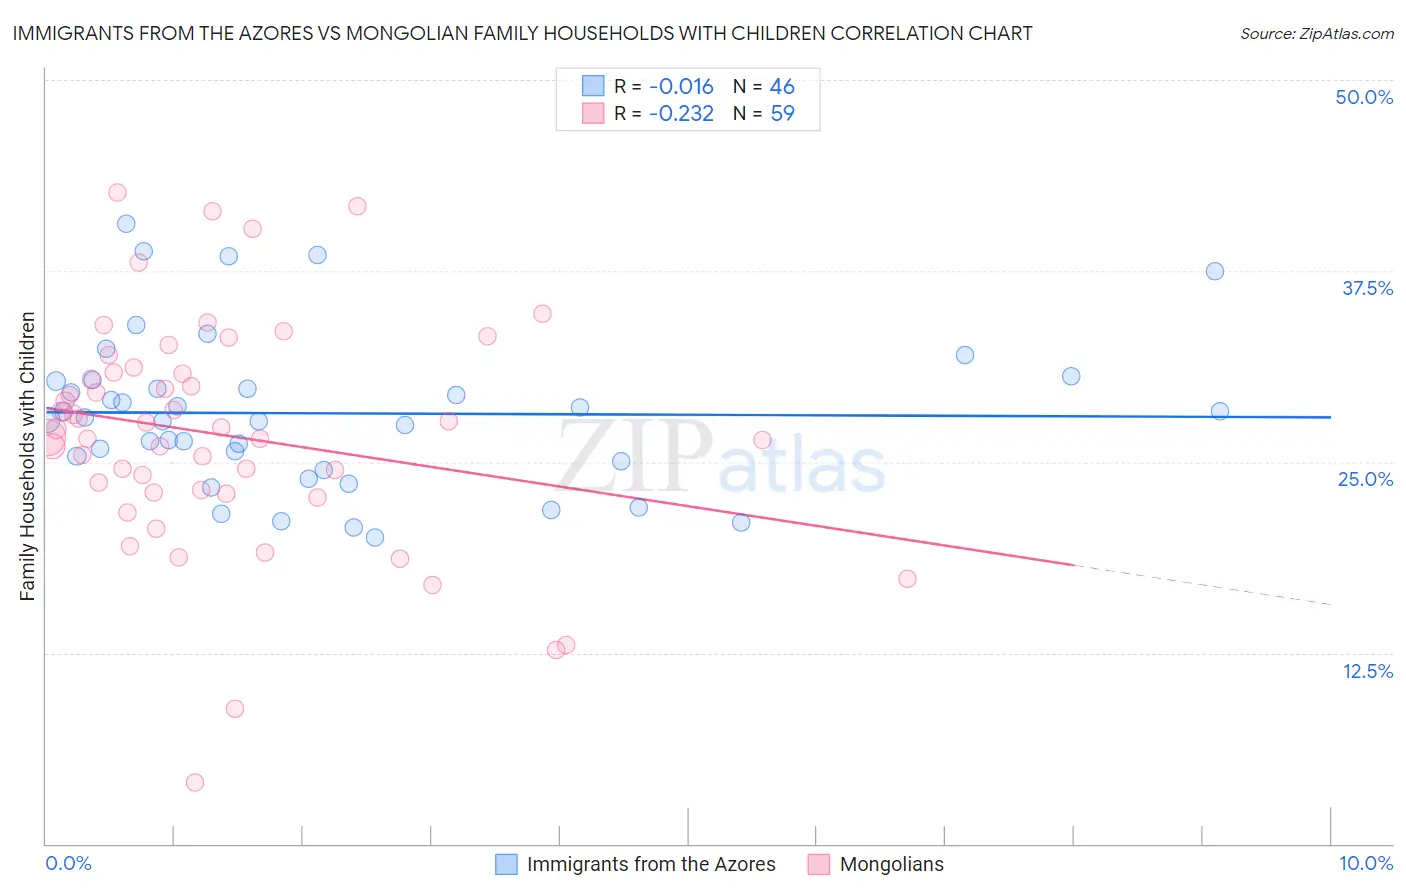
Immigrants from the Azores vs Mongolian Family Households with Children Correlation Chart
The statistical analysis conducted on geographies consisting of 46,253,049 people shows no correlation between the proportion of Immigrants from the Azores and percentage of family households with children in the United States with a correlation coefficient (R) of -0.016 and weighted average of 28.1%. Similarly, the statistical analysis conducted on geographies consisting of 140,279,389 people shows a weak negative correlation between the proportion of Mongolians and percentage of family households with children in the United States with a correlation coefficient (R) of -0.232 and weighted average of 27.6%, a difference of 1.9%.
Family Households with Children Correlation Summary
| Measurement | Immigrants from the Azores | Mongolian |
| Minimum | 20.0% | 4.0% |
| Maximum | 40.6% | 42.6% |
| Range | 20.6% | 38.6% |
| Mean | 28.2% | 26.7% |
| Median | 27.8% | 27.2% |
| Interquartile 25% (IQ1) | 25.0% | 23.0% |
| Interquartile 75% (IQ3) | 30.3% | 30.8% |
| Interquartile Range (IQR) | 5.2% | 7.8% |
| Standard Deviation (Sample) | 5.1% | 7.5% |
| Standard Deviation (Population) | 5.0% | 7.5% |
Similar Demographics by Family Households with Children
Demographics Similar to Immigrants from the Azores by Family Households with Children
In terms of family households with children, the demographic groups most similar to Immigrants from the Azores are Indonesian (28.1%, a difference of 0.0%), Immigrants from Kenya (28.1%, a difference of 0.010%), Immigrants from Oceania (28.1%, a difference of 0.020%), Chilean (28.1%, a difference of 0.050%), and Assyrian/Chaldean/Syriac (28.1%, a difference of 0.050%).
| Demographics | Rating | Rank | Family Households with Children |
| Chickasaw | 99.4 /100 | #92 | Exceptional 28.2% |
| Panamanians | 99.3 /100 | #93 | Exceptional 28.2% |
| Immigrants | Colombia | 99.2 /100 | #94 | Exceptional 28.2% |
| Immigrants | Nicaragua | 99.1 /100 | #95 | Exceptional 28.2% |
| Ute | 99.1 /100 | #96 | Exceptional 28.2% |
| Chileans | 98.9 /100 | #97 | Exceptional 28.1% |
| Immigrants | Kenya | 98.9 /100 | #98 | Exceptional 28.1% |
| Immigrants | Azores | 98.8 /100 | #99 | Exceptional 28.1% |
| Indonesians | 98.8 /100 | #100 | Exceptional 28.1% |
| Immigrants | Oceania | 98.8 /100 | #101 | Exceptional 28.1% |
| Assyrians/Chaldeans/Syriacs | 98.7 /100 | #102 | Exceptional 28.1% |
| Palestinians | 98.5 /100 | #103 | Exceptional 28.1% |
| Sioux | 98.3 /100 | #104 | Exceptional 28.1% |
| Choctaw | 98.3 /100 | #105 | Exceptional 28.1% |
| Immigrants | South America | 98.0 /100 | #106 | Exceptional 28.0% |
Demographics Similar to Mongolians by Family Households with Children
In terms of family households with children, the demographic groups most similar to Mongolians are Romanian (27.6%, a difference of 0.0%), Indian (Asian) (27.6%, a difference of 0.020%), Subsaharan African (27.6%, a difference of 0.080%), Alaskan Athabascan (27.6%, a difference of 0.090%), and Immigrants from Bangladesh (27.6%, a difference of 0.10%).
| Demographics | Rating | Rank | Family Households with Children |
| Ethiopians | 77.0 /100 | #152 | Good 27.6% |
| Immigrants | Cabo Verde | 75.6 /100 | #153 | Good 27.6% |
| Icelanders | 75.3 /100 | #154 | Good 27.6% |
| Comanche | 74.8 /100 | #155 | Good 27.6% |
| Hungarians | 74.6 /100 | #156 | Good 27.6% |
| Indians (Asian) | 71.6 /100 | #157 | Good 27.6% |
| Romanians | 70.8 /100 | #158 | Good 27.6% |
| Mongolians | 70.7 /100 | #159 | Good 27.6% |
| Sub-Saharan Africans | 67.5 /100 | #160 | Good 27.6% |
| Alaskan Athabascans | 67.1 /100 | #161 | Good 27.6% |
| Immigrants | Bangladesh | 67.0 /100 | #162 | Good 27.6% |
| Czechs | 65.3 /100 | #163 | Good 27.5% |
| Immigrants | Hong Kong | 64.9 /100 | #164 | Good 27.5% |
| Immigrants | South Africa | 61.3 /100 | #165 | Good 27.5% |
| Immigrants | Nonimmigrants | 61.2 /100 | #166 | Good 27.5% |