Trinidadian and Tobagonian vs Bolivian Single Father Households
COMPARE
Trinidadian and Tobagonian
Bolivian
Single Father Households
Single Father Households Comparison
Trinidadians and Tobagonians
Bolivians
2.2%
SINGLE FATHER HOUSEHOLDS
97.8/ 100
METRIC RATING
119th/ 347
METRIC RANK
2.3%
SINGLE FATHER HOUSEHOLDS
81.0/ 100
METRIC RATING
154th/ 347
METRIC RANK
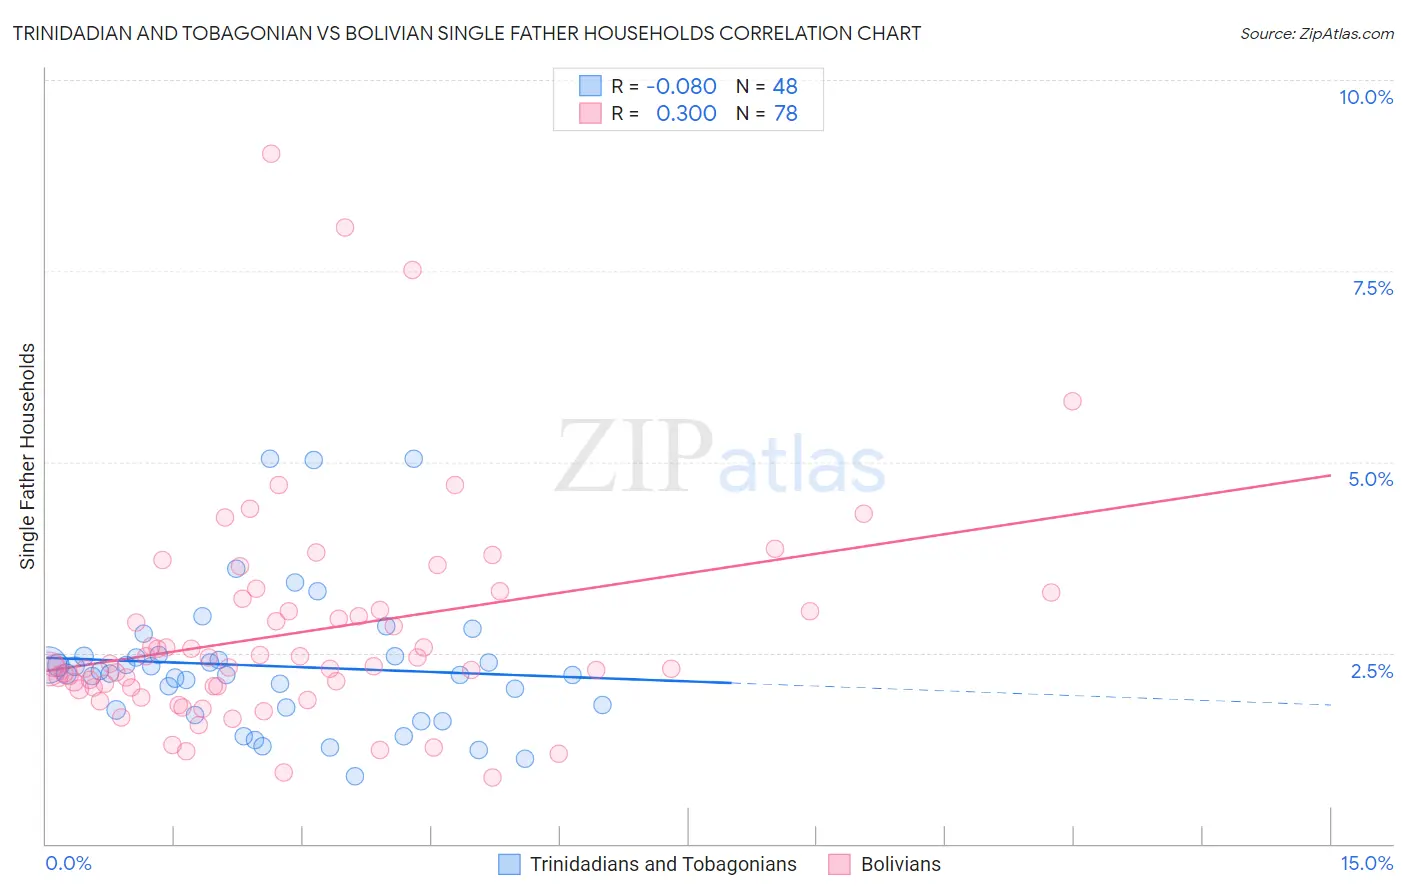
Trinidadian and Tobagonian vs Bolivian Single Father Households Correlation Chart
The statistical analysis conducted on geographies consisting of 218,763,381 people shows a slight negative correlation between the proportion of Trinidadians and Tobagonians and percentage of single father households in the United States with a correlation coefficient (R) of -0.080 and weighted average of 2.2%. Similarly, the statistical analysis conducted on geographies consisting of 184,110,694 people shows a mild positive correlation between the proportion of Bolivians and percentage of single father households in the United States with a correlation coefficient (R) of 0.300 and weighted average of 2.3%, a difference of 4.6%.
Single Father Households Correlation Summary
| Measurement | Trinidadian and Tobagonian | Bolivian |
| Minimum | 0.89% | 0.87% |
| Maximum | 5.0% | 9.0% |
| Range | 4.2% | 8.2% |
| Mean | 2.3% | 2.8% |
| Median | 2.2% | 2.3% |
| Interquartile 25% (IQ1) | 1.8% | 2.0% |
| Interquartile 75% (IQ3) | 2.5% | 3.1% |
| Interquartile Range (IQR) | 0.69% | 1.0% |
| Standard Deviation (Sample) | 0.92% | 1.4% |
| Standard Deviation (Population) | 0.91% | 1.4% |
Similar Demographics by Single Father Households
Demographics Similar to Trinidadians and Tobagonians by Single Father Households
In terms of single father households, the demographic groups most similar to Trinidadians and Tobagonians are Australian (2.2%, a difference of 0.030%), Immigrants from Brazil (2.2%, a difference of 0.040%), Immigrants from Morocco (2.2%, a difference of 0.060%), Immigrants from Iraq (2.2%, a difference of 0.13%), and Hungarian (2.2%, a difference of 0.16%).
| Demographics | Rating | Rank | Single Father Households |
| Immigrants | Trinidad and Tobago | 98.2 /100 | #112 | Exceptional 2.2% |
| Iraqis | 98.2 /100 | #113 | Exceptional 2.2% |
| Immigrants | North America | 98.2 /100 | #114 | Exceptional 2.2% |
| Immigrants | Barbados | 98.2 /100 | #115 | Exceptional 2.2% |
| Immigrants | Argentina | 98.1 /100 | #116 | Exceptional 2.2% |
| Hungarians | 97.9 /100 | #117 | Exceptional 2.2% |
| Immigrants | Morocco | 97.8 /100 | #118 | Exceptional 2.2% |
| Trinidadians and Tobagonians | 97.8 /100 | #119 | Exceptional 2.2% |
| Australians | 97.7 /100 | #120 | Exceptional 2.2% |
| Immigrants | Brazil | 97.7 /100 | #121 | Exceptional 2.2% |
| Immigrants | Iraq | 97.6 /100 | #122 | Exceptional 2.2% |
| Immigrants | Yemen | 97.5 /100 | #123 | Exceptional 2.2% |
| British West Indians | 97.4 /100 | #124 | Exceptional 2.2% |
| Immigrants | Indonesia | 97.4 /100 | #125 | Exceptional 2.2% |
| Moroccans | 96.9 /100 | #126 | Exceptional 2.2% |
Demographics Similar to Bolivians by Single Father Households
In terms of single father households, the demographic groups most similar to Bolivians are European (2.3%, a difference of 0.020%), Immigrants from South America (2.3%, a difference of 0.14%), Canadian (2.3%, a difference of 0.16%), Immigrants from Senegal (2.3%, a difference of 0.19%), and Immigrants from Germany (2.3%, a difference of 0.22%).
| Demographics | Rating | Rank | Single Father Households |
| Slavs | 88.9 /100 | #147 | Excellent 2.2% |
| South American Indians | 88.5 /100 | #148 | Excellent 2.3% |
| Senegalese | 88.4 /100 | #149 | Excellent 2.3% |
| Venezuelans | 86.2 /100 | #150 | Excellent 2.3% |
| Immigrants | Syria | 84.8 /100 | #151 | Excellent 2.3% |
| Immigrants | Venezuela | 83.2 /100 | #152 | Excellent 2.3% |
| Immigrants | Germany | 82.8 /100 | #153 | Excellent 2.3% |
| Bolivians | 81.0 /100 | #154 | Excellent 2.3% |
| Europeans | 80.9 /100 | #155 | Excellent 2.3% |
| Immigrants | South America | 79.9 /100 | #156 | Good 2.3% |
| Canadians | 79.7 /100 | #157 | Good 2.3% |
| Immigrants | Senegal | 79.4 /100 | #158 | Good 2.3% |
| Immigrants | West Indies | 77.9 /100 | #159 | Good 2.3% |
| Immigrants | Bolivia | 76.3 /100 | #160 | Good 2.3% |
| Swiss | 73.2 /100 | #161 | Good 2.3% |