Albanian vs Guamanian/Chamorro Single Father Households
COMPARE
Albanian
Guamanian/Chamorro
Single Father Households
Single Father Households Comparison
Albanians
Guamanians/Chamorros
2.0%
SINGLE FATHER HOUSEHOLDS
100.0/ 100
METRIC RATING
35th/ 347
METRIC RANK
2.6%
SINGLE FATHER HOUSEHOLDS
0.4/ 100
METRIC RATING
267th/ 347
METRIC RANK
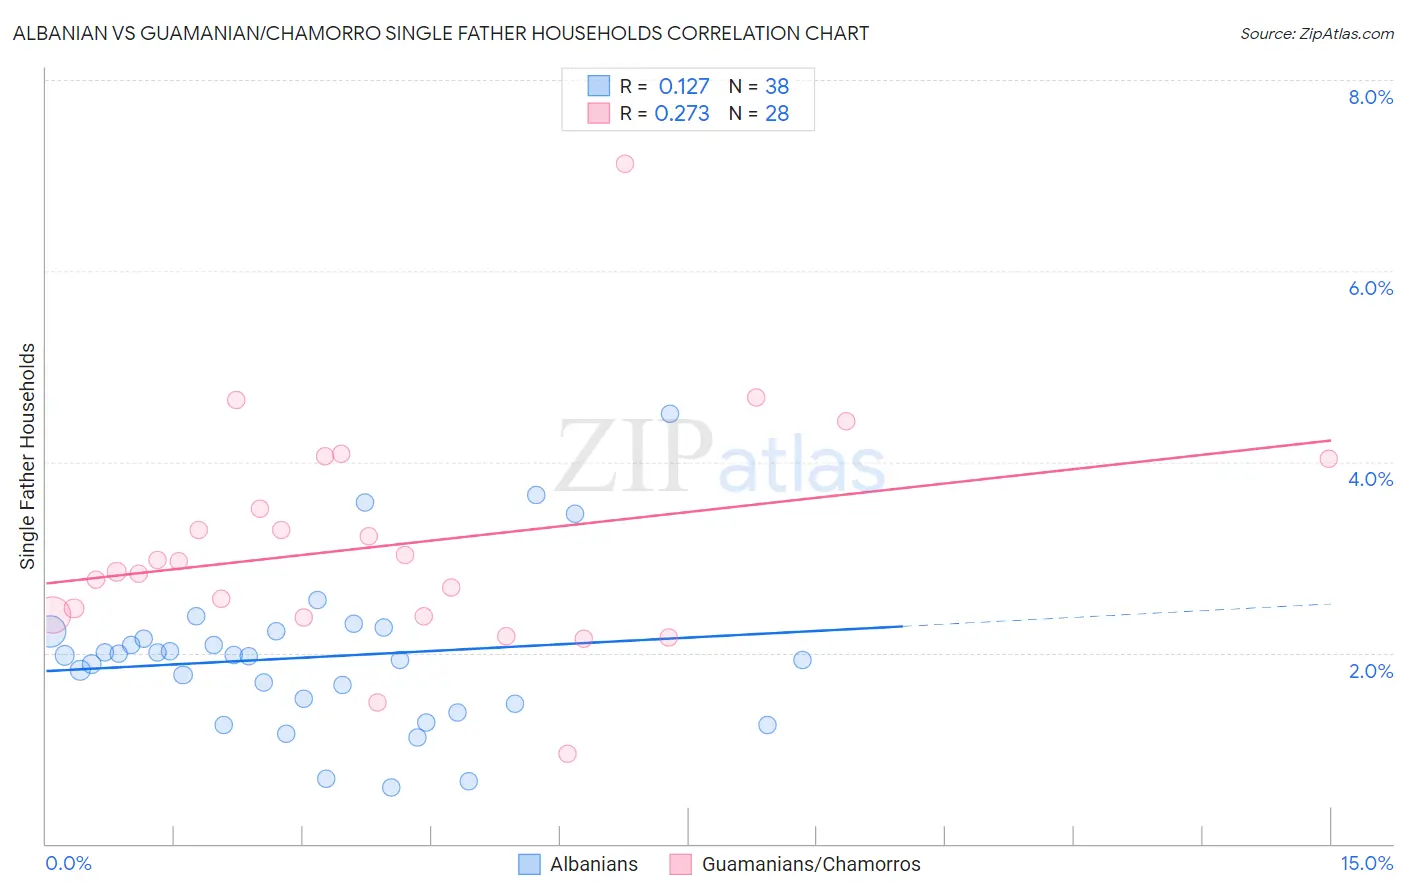
Albanian vs Guamanian/Chamorro Single Father Households Correlation Chart
The statistical analysis conducted on geographies consisting of 192,201,260 people shows a poor positive correlation between the proportion of Albanians and percentage of single father households in the United States with a correlation coefficient (R) of 0.127 and weighted average of 2.0%. Similarly, the statistical analysis conducted on geographies consisting of 221,076,746 people shows a weak positive correlation between the proportion of Guamanians/Chamorros and percentage of single father households in the United States with a correlation coefficient (R) of 0.273 and weighted average of 2.6%, a difference of 30.1%.
Single Father Households Correlation Summary
| Measurement | Albanian | Guamanian/Chamorro |
| Minimum | 0.59% | 0.94% |
| Maximum | 4.5% | 7.1% |
| Range | 3.9% | 6.2% |
| Mean | 2.0% | 3.1% |
| Median | 2.0% | 2.9% |
| Interquartile 25% (IQ1) | 1.5% | 2.4% |
| Interquartile 75% (IQ3) | 2.2% | 3.8% |
| Interquartile Range (IQR) | 0.77% | 1.4% |
| Standard Deviation (Sample) | 0.81% | 1.2% |
| Standard Deviation (Population) | 0.80% | 1.2% |
Similar Demographics by Single Father Households
Demographics Similar to Albanians by Single Father Households
In terms of single father households, the demographic groups most similar to Albanians are Immigrants from Belgium (2.0%, a difference of 0.11%), Immigrants from St. Vincent and the Grenadines (2.0%, a difference of 0.13%), Immigrants from Australia (2.0%, a difference of 0.32%), Turkish (2.0%, a difference of 0.34%), and Immigrants from Eastern Europe (2.0%, a difference of 0.43%).
| Demographics | Rating | Rank | Single Father Households |
| Immigrants | Japan | 100.0 /100 | #28 | Exceptional 2.0% |
| Bulgarians | 100.0 /100 | #29 | Exceptional 2.0% |
| Cambodians | 100.0 /100 | #30 | Exceptional 2.0% |
| Israelis | 100.0 /100 | #31 | Exceptional 2.0% |
| Chinese | 100.0 /100 | #32 | Exceptional 2.0% |
| Turks | 100.0 /100 | #33 | Exceptional 2.0% |
| Immigrants | Australia | 100.0 /100 | #34 | Exceptional 2.0% |
| Albanians | 100.0 /100 | #35 | Exceptional 2.0% |
| Immigrants | Belgium | 100.0 /100 | #36 | Exceptional 2.0% |
| Immigrants | St. Vincent and the Grenadines | 100.0 /100 | #37 | Exceptional 2.0% |
| Immigrants | Eastern Europe | 100.0 /100 | #38 | Exceptional 2.0% |
| Immigrants | Sri Lanka | 100.0 /100 | #39 | Exceptional 2.0% |
| Immigrants | Bulgaria | 100.0 /100 | #40 | Exceptional 2.0% |
| Immigrants | Turkey | 100.0 /100 | #41 | Exceptional 2.0% |
| Macedonians | 100.0 /100 | #42 | Exceptional 2.0% |
Demographics Similar to Guamanians/Chamorros by Single Father Households
In terms of single father households, the demographic groups most similar to Guamanians/Chamorros are Haitian (2.6%, a difference of 0.040%), Cuban (2.6%, a difference of 0.38%), French American Indian (2.6%, a difference of 0.48%), Immigrants from Micronesia (2.6%, a difference of 0.52%), and Seminole (2.6%, a difference of 0.52%).
| Demographics | Rating | Rank | Single Father Households |
| Immigrants | Caribbean | 1.0 /100 | #260 | Tragic 2.5% |
| Immigrants | Belize | 0.9 /100 | #261 | Tragic 2.5% |
| Immigrants | Liberia | 0.8 /100 | #262 | Tragic 2.5% |
| Dominicans | 0.8 /100 | #263 | Tragic 2.5% |
| Indonesians | 0.5 /100 | #264 | Tragic 2.6% |
| Immigrants | Micronesia | 0.5 /100 | #265 | Tragic 2.6% |
| French American Indians | 0.5 /100 | #266 | Tragic 2.6% |
| Guamanians/Chamorros | 0.4 /100 | #267 | Tragic 2.6% |
| Haitians | 0.4 /100 | #268 | Tragic 2.6% |
| Cubans | 0.3 /100 | #269 | Tragic 2.6% |
| Seminole | 0.3 /100 | #270 | Tragic 2.6% |
| Creek | 0.2 /100 | #271 | Tragic 2.6% |
| Belizeans | 0.2 /100 | #272 | Tragic 2.6% |
| Iroquois | 0.2 /100 | #273 | Tragic 2.6% |
| Puerto Ricans | 0.2 /100 | #274 | Tragic 2.6% |