Tongan vs Immigrants from Cameroon Family Households
COMPARE
Tongan
Immigrants from Cameroon
Family Households
Family Households Comparison
Tongans
Immigrants from Cameroon
69.6%
FAMILY HOUSEHOLDS
100.0/ 100
METRIC RATING
3rd/ 347
METRIC RANK
64.7%
FAMILY HOUSEHOLDS
84.8/ 100
METRIC RATING
141st/ 347
METRIC RANK
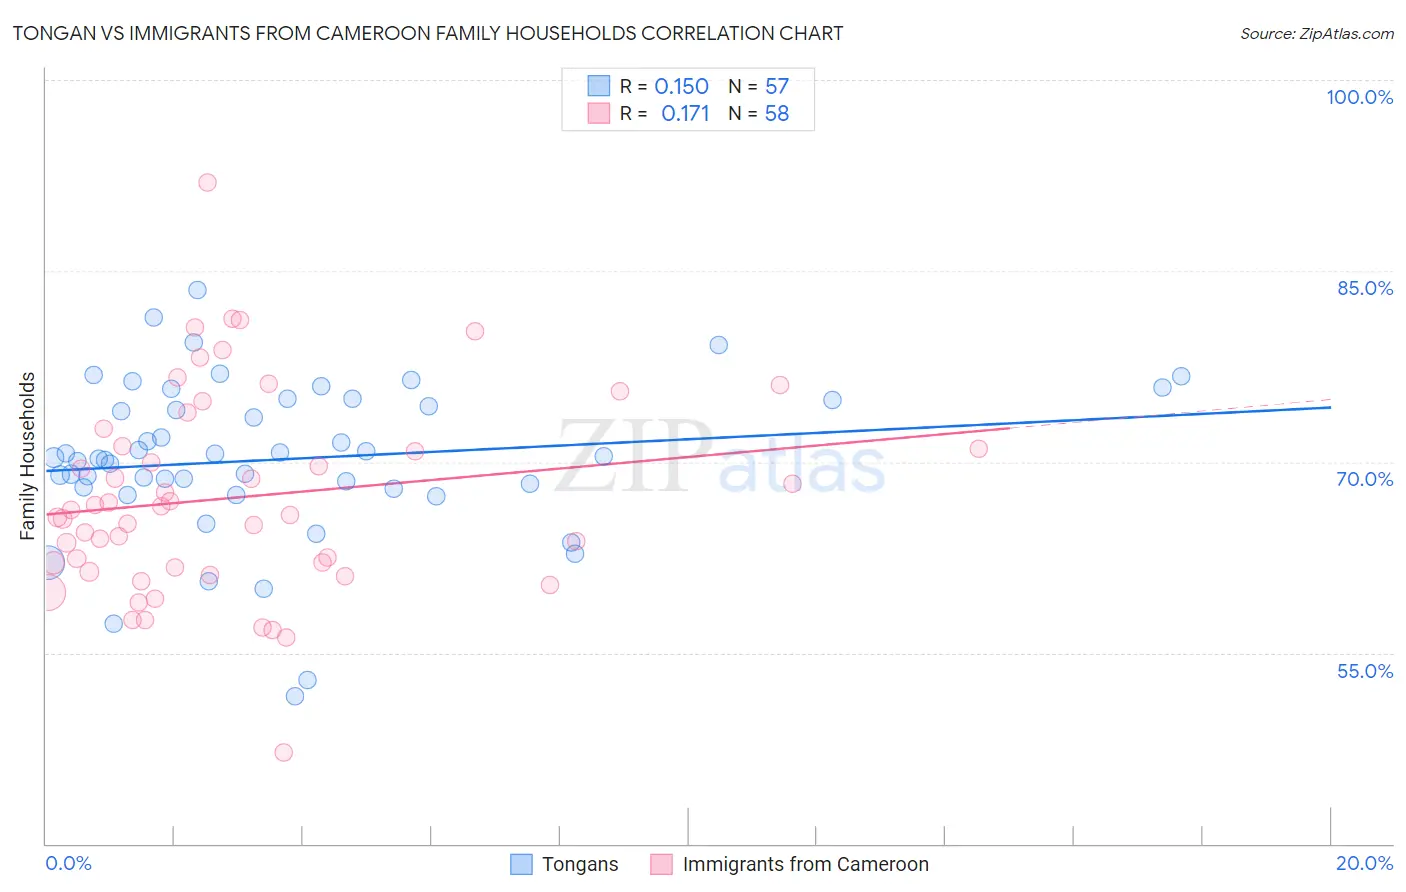
Tongan vs Immigrants from Cameroon Family Households Correlation Chart
The statistical analysis conducted on geographies consisting of 102,870,916 people shows a poor positive correlation between the proportion of Tongans and percentage of family households in the United States with a correlation coefficient (R) of 0.150 and weighted average of 69.6%. Similarly, the statistical analysis conducted on geographies consisting of 130,734,594 people shows a poor positive correlation between the proportion of Immigrants from Cameroon and percentage of family households in the United States with a correlation coefficient (R) of 0.171 and weighted average of 64.7%, a difference of 7.6%.
Family Households Correlation Summary
| Measurement | Tongan | Immigrants from Cameroon |
| Minimum | 51.6% | 47.1% |
| Maximum | 83.5% | 92.0% |
| Range | 31.9% | 44.8% |
| Mean | 70.2% | 67.2% |
| Median | 70.4% | 66.0% |
| Interquartile 25% (IQ1) | 68.0% | 61.7% |
| Interquartile 75% (IQ3) | 74.9% | 71.3% |
| Interquartile Range (IQR) | 7.0% | 9.5% |
| Standard Deviation (Sample) | 6.3% | 8.0% |
| Standard Deviation (Population) | 6.2% | 7.9% |
Similar Demographics by Family Households
Demographics Similar to Tongans by Family Households
In terms of family households, the demographic groups most similar to Tongans are Yakama (69.3%, a difference of 0.44%), Yuman (69.3%, a difference of 0.47%), Immigrants from Mexico (69.1%, a difference of 0.71%), Mexican (69.0%, a difference of 0.92%), and Immigrants from Fiji (68.8%, a difference of 1.2%).
| Demographics | Rating | Rank | Family Households |
| Yup'ik | 100 /100 | #1 | Exceptional 72.4% |
| Spanish American Indians | 100.0 /100 | #2 | Exceptional 71.2% |
| Tongans | 100.0 /100 | #3 | Exceptional 69.6% |
| Yakama | 100.0 /100 | #4 | Exceptional 69.3% |
| Yuman | 100.0 /100 | #5 | Exceptional 69.3% |
| Immigrants | Mexico | 100.0 /100 | #6 | Exceptional 69.1% |
| Mexicans | 100.0 /100 | #7 | Exceptional 69.0% |
| Immigrants | Fiji | 100.0 /100 | #8 | Exceptional 68.8% |
| Native Hawaiians | 100.0 /100 | #9 | Exceptional 68.4% |
| Immigrants | Philippines | 100.0 /100 | #10 | Exceptional 68.3% |
| Immigrants | Central America | 100.0 /100 | #11 | Exceptional 68.3% |
| Koreans | 100.0 /100 | #12 | Exceptional 68.3% |
| Pueblo | 100.0 /100 | #13 | Exceptional 68.2% |
| Immigrants | Cuba | 100.0 /100 | #14 | Exceptional 68.2% |
| Assyrians/Chaldeans/Syriacs | 100.0 /100 | #15 | Exceptional 68.2% |
Demographics Similar to Immigrants from Cameroon by Family Households
In terms of family households, the demographic groups most similar to Immigrants from Cameroon are Immigrants from North Macedonia (64.7%, a difference of 0.0%), Immigrants from Jamaica (64.7%, a difference of 0.010%), Basque (64.7%, a difference of 0.020%), Pakistani (64.7%, a difference of 0.020%), and Immigrants from Scotland (64.7%, a difference of 0.040%).
| Demographics | Rating | Rank | Family Households |
| Greeks | 88.1 /100 | #134 | Excellent 64.7% |
| Maltese | 87.4 /100 | #135 | Excellent 64.7% |
| Immigrants | China | 86.6 /100 | #136 | Excellent 64.7% |
| Immigrants | Scotland | 86.4 /100 | #137 | Excellent 64.7% |
| Basques | 85.5 /100 | #138 | Excellent 64.7% |
| Immigrants | Jamaica | 85.3 /100 | #139 | Excellent 64.7% |
| Immigrants | North Macedonia | 84.9 /100 | #140 | Excellent 64.7% |
| Immigrants | Cameroon | 84.8 /100 | #141 | Excellent 64.7% |
| Pakistanis | 84.0 /100 | #142 | Excellent 64.7% |
| Czechoslovakians | 82.1 /100 | #143 | Excellent 64.6% |
| South American Indians | 81.9 /100 | #144 | Excellent 64.6% |
| Welsh | 80.1 /100 | #145 | Excellent 64.6% |
| Immigrants | Romania | 77.0 /100 | #146 | Good 64.6% |
| Immigrants | Chile | 76.5 /100 | #147 | Good 64.6% |
| Delaware | 76.3 /100 | #148 | Good 64.6% |