Tongan vs Immigrants from Cameroon Unemployment Among Women with Children Under 18 years
COMPARE
Tongan
Immigrants from Cameroon
Unemployment Among Women with Children Under 18 years
Unemployment Among Women with Children Under 18 years Comparison
Tongans
Immigrants from Cameroon
4.7%
UNEMPLOYMENT AMONG WOMEN WITH CHILDREN UNDER 18 YEARS
100.0/ 100
METRIC RATING
5th/ 347
METRIC RANK
5.9%
UNEMPLOYMENT AMONG WOMEN WITH CHILDREN UNDER 18 YEARS
0.8/ 100
METRIC RATING
249th/ 347
METRIC RANK
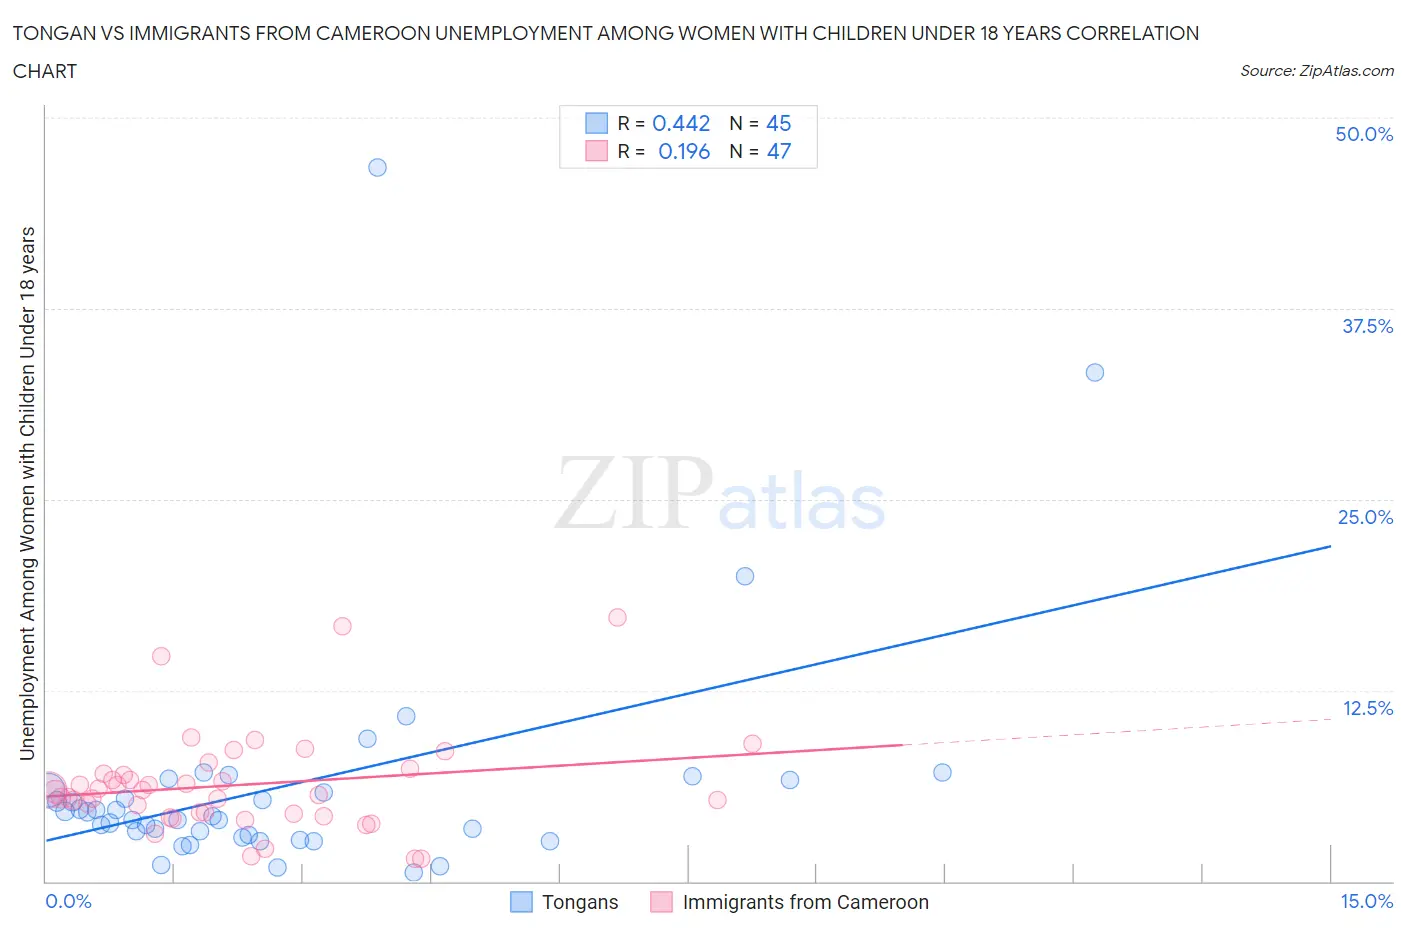
Tongan vs Immigrants from Cameroon Unemployment Among Women with Children Under 18 years Correlation Chart
The statistical analysis conducted on geographies consisting of 101,502,527 people shows a moderate positive correlation between the proportion of Tongans and unemployment rate among women with children under the age of 18 in the United States with a correlation coefficient (R) of 0.442 and weighted average of 4.7%. Similarly, the statistical analysis conducted on geographies consisting of 129,420,330 people shows a poor positive correlation between the proportion of Immigrants from Cameroon and unemployment rate among women with children under the age of 18 in the United States with a correlation coefficient (R) of 0.196 and weighted average of 5.9%, a difference of 26.9%.
Unemployment Among Women with Children Under 18 years Correlation Summary
| Measurement | Tongan | Immigrants from Cameroon |
| Minimum | 0.60% | 1.5% |
| Maximum | 46.7% | 17.3% |
| Range | 46.1% | 15.8% |
| Mean | 6.3% | 6.3% |
| Median | 4.2% | 5.9% |
| Interquartile 25% (IQ1) | 2.9% | 4.5% |
| Interquartile 75% (IQ3) | 6.3% | 7.0% |
| Interquartile Range (IQR) | 3.3% | 2.6% |
| Standard Deviation (Sample) | 8.1% | 3.3% |
| Standard Deviation (Population) | 8.0% | 3.2% |
Similar Demographics by Unemployment Among Women with Children Under 18 years
Demographics Similar to Tongans by Unemployment Among Women with Children Under 18 years
In terms of unemployment among women with children under 18 years, the demographic groups most similar to Tongans are Swedish (4.7%, a difference of 0.050%), Immigrants from Taiwan (4.7%, a difference of 0.11%), Immigrants from India (4.7%, a difference of 0.22%), Immigrants from Hong Kong (4.7%, a difference of 0.63%), and Okinawan (4.7%, a difference of 1.5%).
| Demographics | Rating | Rank | Unemployment Among Women with Children Under 18 years |
| Norwegians | 100.0 /100 | #1 | Exceptional 4.4% |
| Hmong | 100.0 /100 | #2 | Exceptional 4.5% |
| Danes | 100.0 /100 | #3 | Exceptional 4.5% |
| Swedes | 100.0 /100 | #4 | Exceptional 4.7% |
| Tongans | 100.0 /100 | #5 | Exceptional 4.7% |
| Immigrants | Taiwan | 100.0 /100 | #6 | Exceptional 4.7% |
| Immigrants | India | 100.0 /100 | #7 | Exceptional 4.7% |
| Immigrants | Hong Kong | 100.0 /100 | #8 | Exceptional 4.7% |
| Okinawans | 99.9 /100 | #9 | Exceptional 4.7% |
| Czechs | 99.9 /100 | #10 | Exceptional 4.7% |
| Filipinos | 99.9 /100 | #11 | Exceptional 4.8% |
| Scandinavians | 99.9 /100 | #12 | Exceptional 4.8% |
| Bulgarians | 99.9 /100 | #13 | Exceptional 4.8% |
| Cambodians | 99.9 /100 | #14 | Exceptional 4.8% |
| Thais | 99.8 /100 | #15 | Exceptional 4.8% |
Demographics Similar to Immigrants from Cameroon by Unemployment Among Women with Children Under 18 years
In terms of unemployment among women with children under 18 years, the demographic groups most similar to Immigrants from Cameroon are Immigrants from Cabo Verde (5.9%, a difference of 0.070%), Ute (5.9%, a difference of 0.080%), Delaware (5.9%, a difference of 0.15%), Cape Verdean (5.9%, a difference of 0.37%), and Uruguayan (5.9%, a difference of 0.44%).
| Demographics | Rating | Rank | Unemployment Among Women with Children Under 18 years |
| Moroccans | 1.4 /100 | #242 | Tragic 5.9% |
| Immigrants | Uruguay | 1.1 /100 | #243 | Tragic 5.9% |
| Choctaw | 1.1 /100 | #244 | Tragic 5.9% |
| Ugandans | 1.1 /100 | #245 | Tragic 5.9% |
| Uruguayans | 1.0 /100 | #246 | Tragic 5.9% |
| Cape Verdeans | 1.0 /100 | #247 | Tragic 5.9% |
| Delaware | 0.8 /100 | #248 | Tragic 5.9% |
| Immigrants | Cameroon | 0.8 /100 | #249 | Tragic 5.9% |
| Immigrants | Cabo Verde | 0.7 /100 | #250 | Tragic 5.9% |
| Ute | 0.7 /100 | #251 | Tragic 5.9% |
| Seminole | 0.5 /100 | #252 | Tragic 6.0% |
| Immigrants | Congo | 0.4 /100 | #253 | Tragic 6.0% |
| Immigrants | Azores | 0.3 /100 | #254 | Tragic 6.0% |
| Liberians | 0.2 /100 | #255 | Tragic 6.0% |
| Nepalese | 0.2 /100 | #256 | Tragic 6.0% |