Tongan vs Immigrants from Congo Family Households
COMPARE
Tongan
Immigrants from Congo
Family Households
Family Households Comparison
Tongans
Immigrants from Congo
69.6%
FAMILY HOUSEHOLDS
100.0/ 100
METRIC RATING
3rd/ 347
METRIC RANK
59.2%
FAMILY HOUSEHOLDS
0.0/ 100
METRIC RATING
344th/ 347
METRIC RANK
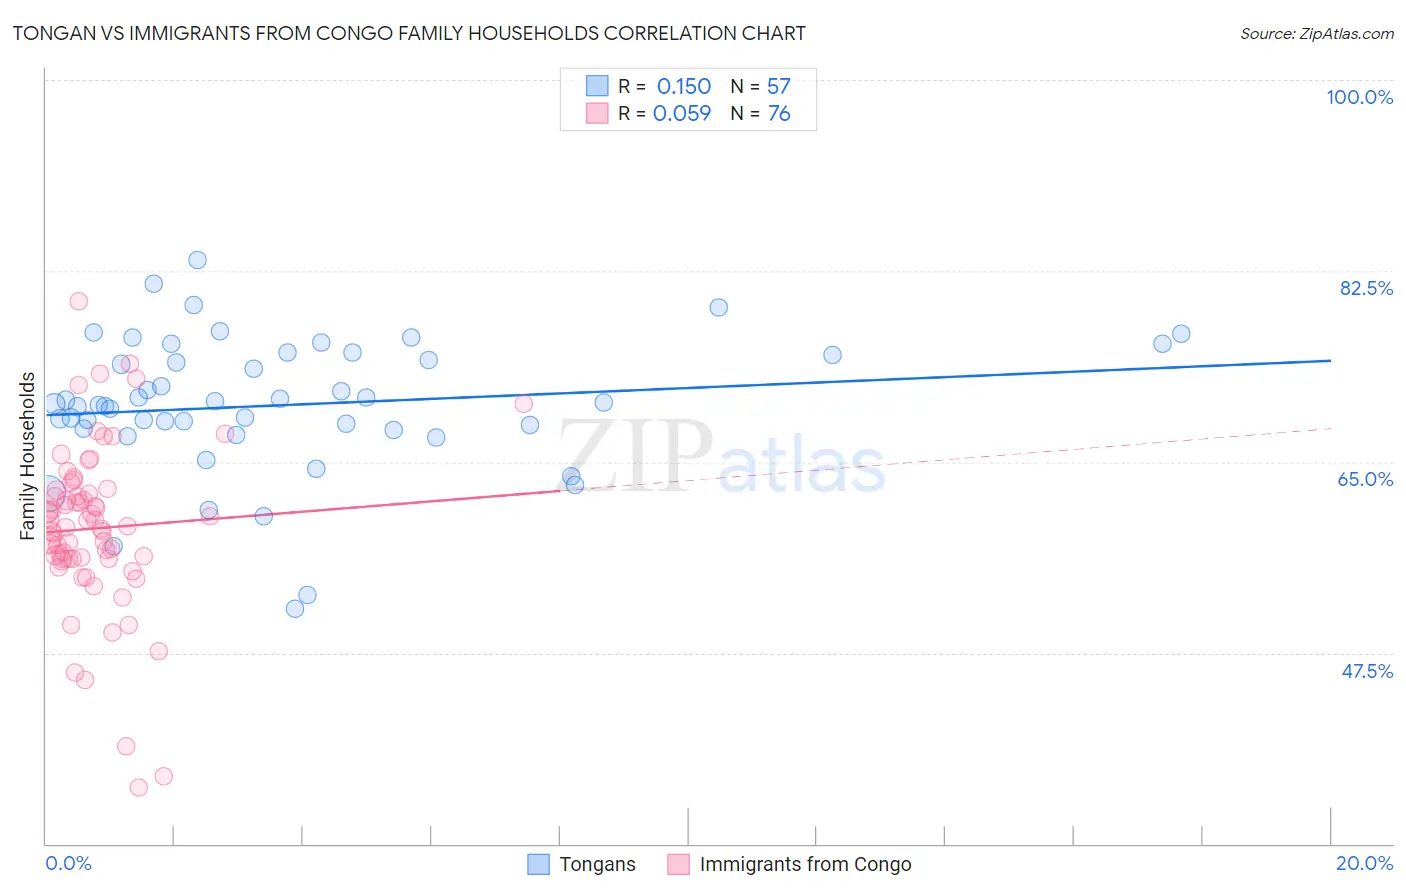
Tongan vs Immigrants from Congo Family Households Correlation Chart
The statistical analysis conducted on geographies consisting of 102,870,916 people shows a poor positive correlation between the proportion of Tongans and percentage of family households in the United States with a correlation coefficient (R) of 0.150 and weighted average of 69.6%. Similarly, the statistical analysis conducted on geographies consisting of 92,089,117 people shows a slight positive correlation between the proportion of Immigrants from Congo and percentage of family households in the United States with a correlation coefficient (R) of 0.059 and weighted average of 59.2%, a difference of 17.5%.
Family Households Correlation Summary
| Measurement | Tongan | Immigrants from Congo |
| Minimum | 51.6% | 35.2% |
| Maximum | 83.5% | 79.8% |
| Range | 31.9% | 44.6% |
| Mean | 70.2% | 58.9% |
| Median | 70.4% | 59.0% |
| Interquartile 25% (IQ1) | 68.0% | 56.1% |
| Interquartile 75% (IQ3) | 74.9% | 62.2% |
| Interquartile Range (IQR) | 7.0% | 6.1% |
| Standard Deviation (Sample) | 6.3% | 7.7% |
| Standard Deviation (Population) | 6.2% | 7.6% |
Similar Demographics by Family Households
Demographics Similar to Tongans by Family Households
In terms of family households, the demographic groups most similar to Tongans are Yakama (69.3%, a difference of 0.44%), Yuman (69.3%, a difference of 0.47%), Immigrants from Mexico (69.1%, a difference of 0.71%), Mexican (69.0%, a difference of 0.92%), and Immigrants from Fiji (68.8%, a difference of 1.2%).
| Demographics | Rating | Rank | Family Households |
| Yup'ik | 100 /100 | #1 | Exceptional 72.4% |
| Spanish American Indians | 100.0 /100 | #2 | Exceptional 71.2% |
| Tongans | 100.0 /100 | #3 | Exceptional 69.6% |
| Yakama | 100.0 /100 | #4 | Exceptional 69.3% |
| Yuman | 100.0 /100 | #5 | Exceptional 69.3% |
| Immigrants | Mexico | 100.0 /100 | #6 | Exceptional 69.1% |
| Mexicans | 100.0 /100 | #7 | Exceptional 69.0% |
| Immigrants | Fiji | 100.0 /100 | #8 | Exceptional 68.8% |
| Native Hawaiians | 100.0 /100 | #9 | Exceptional 68.4% |
| Immigrants | Philippines | 100.0 /100 | #10 | Exceptional 68.3% |
| Immigrants | Central America | 100.0 /100 | #11 | Exceptional 68.3% |
| Koreans | 100.0 /100 | #12 | Exceptional 68.3% |
| Pueblo | 100.0 /100 | #13 | Exceptional 68.2% |
| Immigrants | Cuba | 100.0 /100 | #14 | Exceptional 68.2% |
| Assyrians/Chaldeans/Syriacs | 100.0 /100 | #15 | Exceptional 68.2% |
Demographics Similar to Immigrants from Congo by Family Households
In terms of family households, the demographic groups most similar to Immigrants from Congo are Immigrants from Zaire (59.2%, a difference of 0.14%), Senegalese (59.8%, a difference of 0.97%), Sudanese (60.0%, a difference of 1.3%), Immigrants from Senegal (60.1%, a difference of 1.5%), and Immigrants from Sudan (60.2%, a difference of 1.5%).
| Demographics | Rating | Rank | Family Households |
| Immigrants | Ethiopia | 0.0 /100 | #333 | Tragic 61.2% |
| Immigrants | Eastern Africa | 0.0 /100 | #334 | Tragic 61.1% |
| Carpatho Rusyns | 0.0 /100 | #335 | Tragic 61.1% |
| German Russians | 0.0 /100 | #336 | Tragic 60.9% |
| Soviet Union | 0.0 /100 | #337 | Tragic 60.9% |
| Immigrants | Eritrea | 0.0 /100 | #338 | Tragic 60.8% |
| Immigrants | Saudi Arabia | 0.0 /100 | #339 | Tragic 60.7% |
| Immigrants | Sudan | 0.0 /100 | #340 | Tragic 60.2% |
| Immigrants | Senegal | 0.0 /100 | #341 | Tragic 60.1% |
| Sudanese | 0.0 /100 | #342 | Tragic 60.0% |
| Senegalese | 0.0 /100 | #343 | Tragic 59.8% |
| Immigrants | Congo | 0.0 /100 | #344 | Tragic 59.2% |
| Immigrants | Zaire | 0.0 /100 | #345 | Tragic 59.2% |
| Somalis | 0.0 /100 | #346 | Tragic 57.6% |
| Immigrants | Somalia | 0.0 /100 | #347 | Tragic 56.7% |