Mongolian vs Immigrants from Cameroon Family Households
COMPARE
Mongolian
Immigrants from Cameroon
Family Households
Family Households Comparison
Mongolians
Immigrants from Cameroon
62.8%
FAMILY HOUSEHOLDS
0.1/ 100
METRIC RATING
285th/ 347
METRIC RANK
64.7%
FAMILY HOUSEHOLDS
84.8/ 100
METRIC RATING
141st/ 347
METRIC RANK
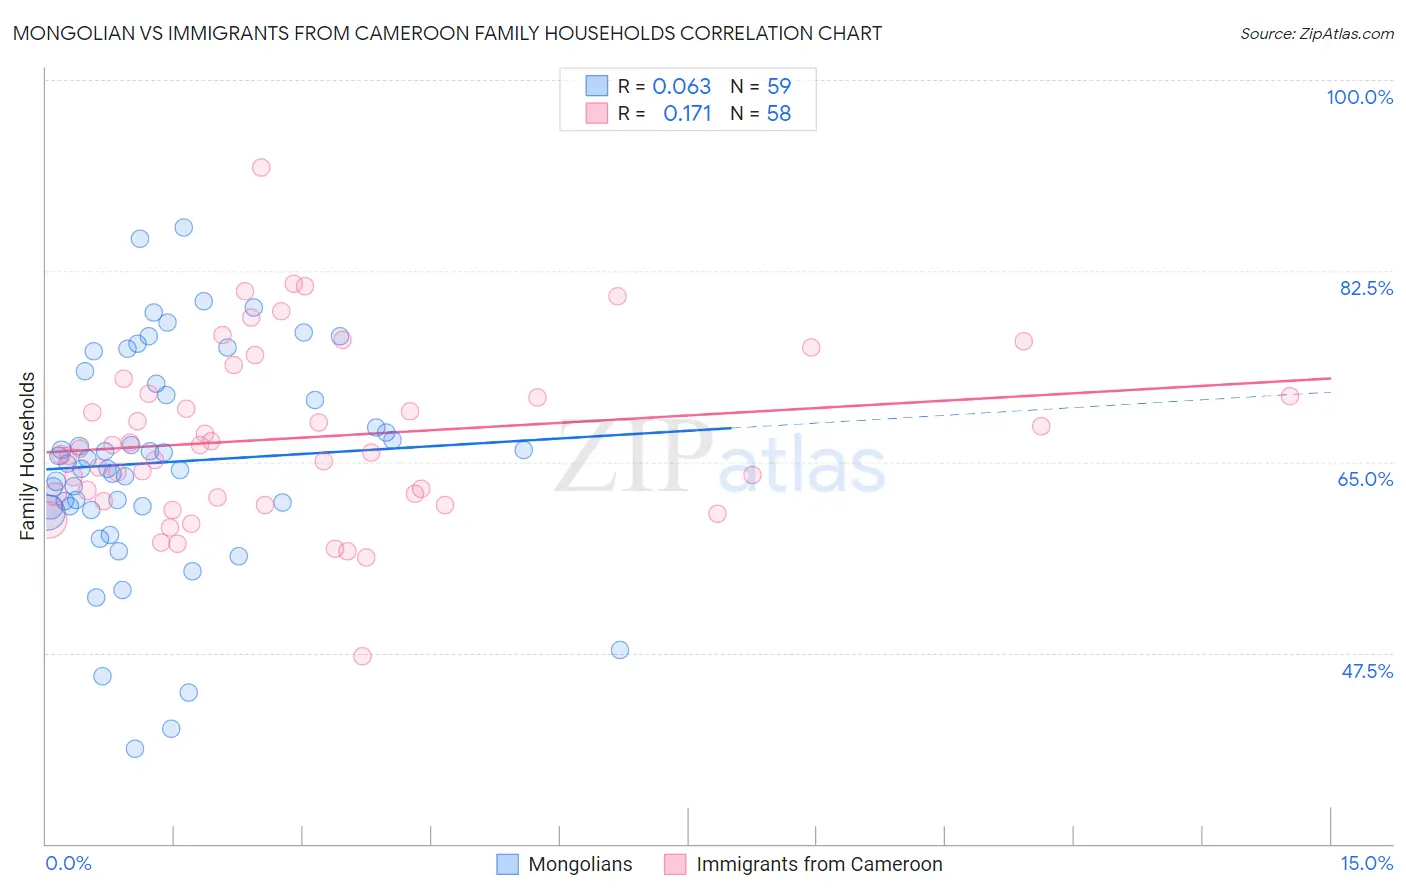
Mongolian vs Immigrants from Cameroon Family Households Correlation Chart
The statistical analysis conducted on geographies consisting of 140,293,840 people shows a slight positive correlation between the proportion of Mongolians and percentage of family households in the United States with a correlation coefficient (R) of 0.063 and weighted average of 62.8%. Similarly, the statistical analysis conducted on geographies consisting of 130,734,594 people shows a poor positive correlation between the proportion of Immigrants from Cameroon and percentage of family households in the United States with a correlation coefficient (R) of 0.171 and weighted average of 64.7%, a difference of 3.0%.
Family Households Correlation Summary
| Measurement | Mongolian | Immigrants from Cameroon |
| Minimum | 38.8% | 47.1% |
| Maximum | 86.5% | 92.0% |
| Range | 47.8% | 44.8% |
| Mean | 65.0% | 67.2% |
| Median | 64.9% | 66.0% |
| Interquartile 25% (IQ1) | 60.9% | 61.7% |
| Interquartile 75% (IQ3) | 72.2% | 71.3% |
| Interquartile Range (IQR) | 11.3% | 9.5% |
| Standard Deviation (Sample) | 10.1% | 8.0% |
| Standard Deviation (Population) | 10.0% | 7.9% |
Similar Demographics by Family Households
Demographics Similar to Mongolians by Family Households
In terms of family households, the demographic groups most similar to Mongolians are British West Indian (62.8%, a difference of 0.030%), Latvian (62.8%, a difference of 0.030%), Immigrants from Uganda (62.7%, a difference of 0.050%), Australian (62.8%, a difference of 0.10%), and Immigrants from Nepal (62.7%, a difference of 0.14%).
| Demographics | Rating | Rank | Family Households |
| Immigrants | Belgium | 0.2 /100 | #278 | Tragic 63.0% |
| Immigrants | Yemen | 0.2 /100 | #279 | Tragic 63.0% |
| Immigrants | Bulgaria | 0.2 /100 | #280 | Tragic 63.0% |
| Estonians | 0.2 /100 | #281 | Tragic 62.9% |
| New Zealanders | 0.1 /100 | #282 | Tragic 62.9% |
| Immigrants | Denmark | 0.1 /100 | #283 | Tragic 62.9% |
| Australians | 0.1 /100 | #284 | Tragic 62.8% |
| Mongolians | 0.1 /100 | #285 | Tragic 62.8% |
| British West Indians | 0.1 /100 | #286 | Tragic 62.8% |
| Latvians | 0.1 /100 | #287 | Tragic 62.8% |
| Immigrants | Uganda | 0.1 /100 | #288 | Tragic 62.7% |
| Immigrants | Nepal | 0.1 /100 | #289 | Tragic 62.7% |
| Immigrants | Grenada | 0.0 /100 | #290 | Tragic 62.6% |
| U.S. Virgin Islanders | 0.0 /100 | #291 | Tragic 62.6% |
| Immigrants | Burma/Myanmar | 0.0 /100 | #292 | Tragic 62.6% |
Demographics Similar to Immigrants from Cameroon by Family Households
In terms of family households, the demographic groups most similar to Immigrants from Cameroon are Immigrants from North Macedonia (64.7%, a difference of 0.0%), Immigrants from Jamaica (64.7%, a difference of 0.010%), Basque (64.7%, a difference of 0.020%), Pakistani (64.7%, a difference of 0.020%), and Immigrants from Scotland (64.7%, a difference of 0.040%).
| Demographics | Rating | Rank | Family Households |
| Greeks | 88.1 /100 | #134 | Excellent 64.7% |
| Maltese | 87.4 /100 | #135 | Excellent 64.7% |
| Immigrants | China | 86.6 /100 | #136 | Excellent 64.7% |
| Immigrants | Scotland | 86.4 /100 | #137 | Excellent 64.7% |
| Basques | 85.5 /100 | #138 | Excellent 64.7% |
| Immigrants | Jamaica | 85.3 /100 | #139 | Excellent 64.7% |
| Immigrants | North Macedonia | 84.9 /100 | #140 | Excellent 64.7% |
| Immigrants | Cameroon | 84.8 /100 | #141 | Excellent 64.7% |
| Pakistanis | 84.0 /100 | #142 | Excellent 64.7% |
| Czechoslovakians | 82.1 /100 | #143 | Excellent 64.6% |
| South American Indians | 81.9 /100 | #144 | Excellent 64.6% |
| Welsh | 80.1 /100 | #145 | Excellent 64.6% |
| Immigrants | Romania | 77.0 /100 | #146 | Good 64.6% |
| Immigrants | Chile | 76.5 /100 | #147 | Good 64.6% |
| Delaware | 76.3 /100 | #148 | Good 64.6% |