Nicaraguan vs Immigrants from Cameroon Family Households
COMPARE
Nicaraguan
Immigrants from Cameroon
Family Households
Family Households Comparison
Nicaraguans
Immigrants from Cameroon
67.4%
FAMILY HOUSEHOLDS
100.0/ 100
METRIC RATING
29th/ 347
METRIC RANK
64.7%
FAMILY HOUSEHOLDS
84.8/ 100
METRIC RATING
141st/ 347
METRIC RANK
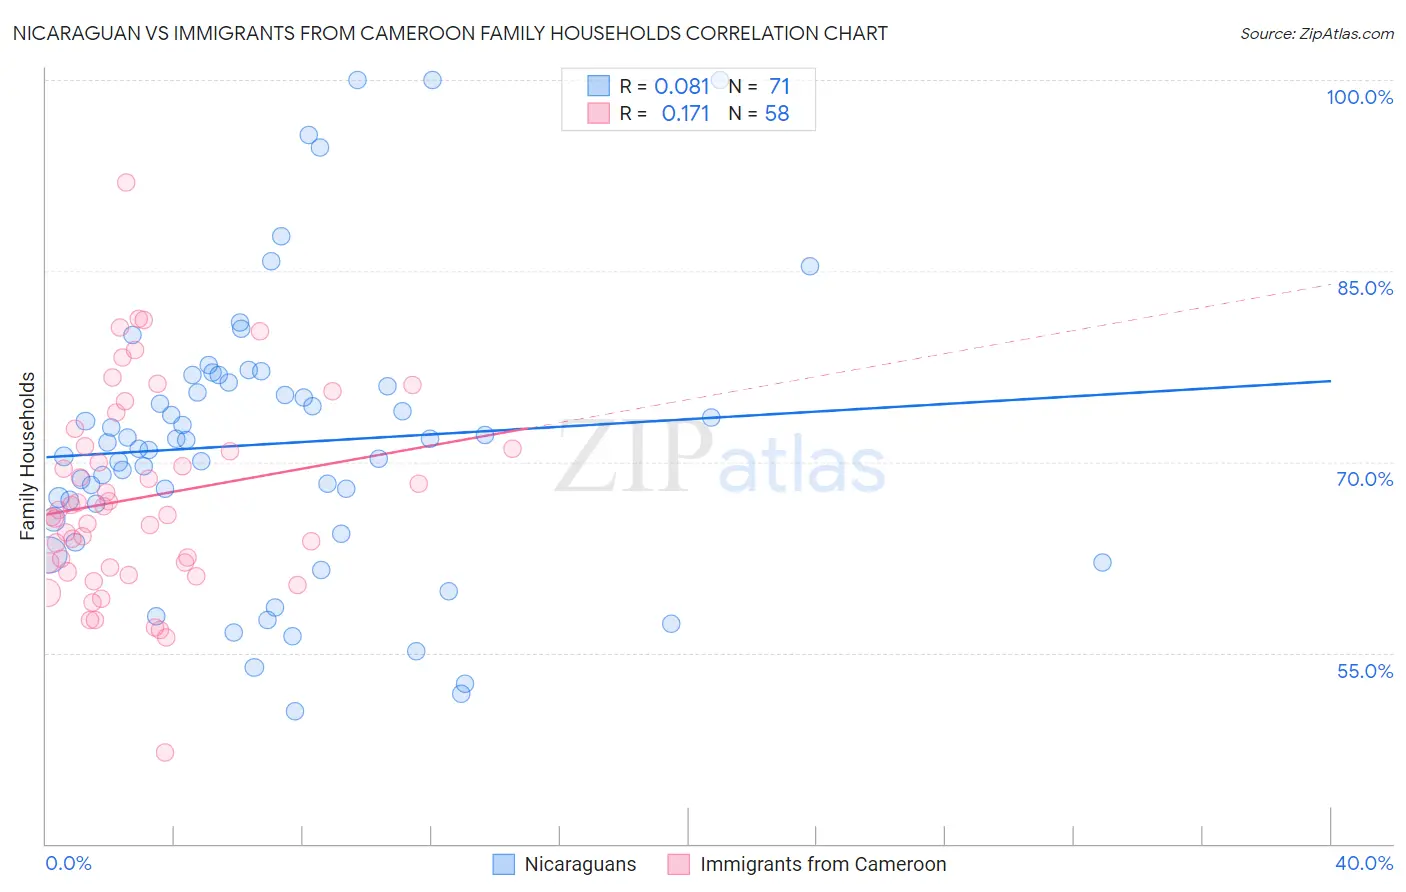
Nicaraguan vs Immigrants from Cameroon Family Households Correlation Chart
The statistical analysis conducted on geographies consisting of 285,625,723 people shows a slight positive correlation between the proportion of Nicaraguans and percentage of family households in the United States with a correlation coefficient (R) of 0.081 and weighted average of 67.4%. Similarly, the statistical analysis conducted on geographies consisting of 130,734,594 people shows a poor positive correlation between the proportion of Immigrants from Cameroon and percentage of family households in the United States with a correlation coefficient (R) of 0.171 and weighted average of 64.7%, a difference of 4.2%.
Family Households Correlation Summary
| Measurement | Nicaraguan | Immigrants from Cameroon |
| Minimum | 50.4% | 47.1% |
| Maximum | 100.0% | 92.0% |
| Range | 49.6% | 44.8% |
| Mean | 71.4% | 67.2% |
| Median | 71.5% | 66.0% |
| Interquartile 25% (IQ1) | 65.5% | 61.7% |
| Interquartile 75% (IQ3) | 76.3% | 71.3% |
| Interquartile Range (IQR) | 10.8% | 9.5% |
| Standard Deviation (Sample) | 11.0% | 8.0% |
| Standard Deviation (Population) | 10.9% | 7.9% |
Similar Demographics by Family Households
Demographics Similar to Nicaraguans by Family Households
In terms of family households, the demographic groups most similar to Nicaraguans are Hawaiian (67.4%, a difference of 0.070%), Hispanic or Latino (67.4%, a difference of 0.080%), Immigrants from India (67.4%, a difference of 0.13%), Immigrants from Nicaragua (67.5%, a difference of 0.14%), and Immigrants from South Eastern Asia (67.5%, a difference of 0.16%).
| Demographics | Rating | Rank | Family Households |
| Sri Lankans | 100.0 /100 | #22 | Exceptional 67.7% |
| Immigrants | Pakistan | 100.0 /100 | #23 | Exceptional 67.7% |
| Immigrants | South Eastern Asia | 100.0 /100 | #24 | Exceptional 67.5% |
| Immigrants | Nicaragua | 100.0 /100 | #25 | Exceptional 67.5% |
| Immigrants | India | 100.0 /100 | #26 | Exceptional 67.4% |
| Hispanics or Latinos | 100.0 /100 | #27 | Exceptional 67.4% |
| Hawaiians | 100.0 /100 | #28 | Exceptional 67.4% |
| Nicaraguans | 100.0 /100 | #29 | Exceptional 67.4% |
| Immigrants | Peru | 100.0 /100 | #30 | Exceptional 67.2% |
| Immigrants | Latin America | 100.0 /100 | #31 | Exceptional 67.2% |
| Nepalese | 100.0 /100 | #32 | Exceptional 67.2% |
| Salvadorans | 100.0 /100 | #33 | Exceptional 67.2% |
| Thais | 100.0 /100 | #34 | Exceptional 67.2% |
| Tohono O'odham | 100.0 /100 | #35 | Exceptional 67.1% |
| Peruvians | 100.0 /100 | #36 | Exceptional 67.1% |
Demographics Similar to Immigrants from Cameroon by Family Households
In terms of family households, the demographic groups most similar to Immigrants from Cameroon are Immigrants from North Macedonia (64.7%, a difference of 0.0%), Immigrants from Jamaica (64.7%, a difference of 0.010%), Basque (64.7%, a difference of 0.020%), Pakistani (64.7%, a difference of 0.020%), and Immigrants from Scotland (64.7%, a difference of 0.040%).
| Demographics | Rating | Rank | Family Households |
| Greeks | 88.1 /100 | #134 | Excellent 64.7% |
| Maltese | 87.4 /100 | #135 | Excellent 64.7% |
| Immigrants | China | 86.6 /100 | #136 | Excellent 64.7% |
| Immigrants | Scotland | 86.4 /100 | #137 | Excellent 64.7% |
| Basques | 85.5 /100 | #138 | Excellent 64.7% |
| Immigrants | Jamaica | 85.3 /100 | #139 | Excellent 64.7% |
| Immigrants | North Macedonia | 84.9 /100 | #140 | Excellent 64.7% |
| Immigrants | Cameroon | 84.8 /100 | #141 | Excellent 64.7% |
| Pakistanis | 84.0 /100 | #142 | Excellent 64.7% |
| Czechoslovakians | 82.1 /100 | #143 | Excellent 64.6% |
| South American Indians | 81.9 /100 | #144 | Excellent 64.6% |
| Welsh | 80.1 /100 | #145 | Excellent 64.6% |
| Immigrants | Romania | 77.0 /100 | #146 | Good 64.6% |
| Immigrants | Chile | 76.5 /100 | #147 | Good 64.6% |
| Delaware | 76.3 /100 | #148 | Good 64.6% |