Tongan vs Ukrainian Family Households
COMPARE
Tongan
Ukrainian
Family Households
Family Households Comparison
Tongans
Ukrainians
69.6%
FAMILY HOUSEHOLDS
100.0/ 100
METRIC RATING
3rd/ 347
METRIC RANK
64.2%
FAMILY HOUSEHOLDS
34.6/ 100
METRIC RATING
182nd/ 347
METRIC RANK
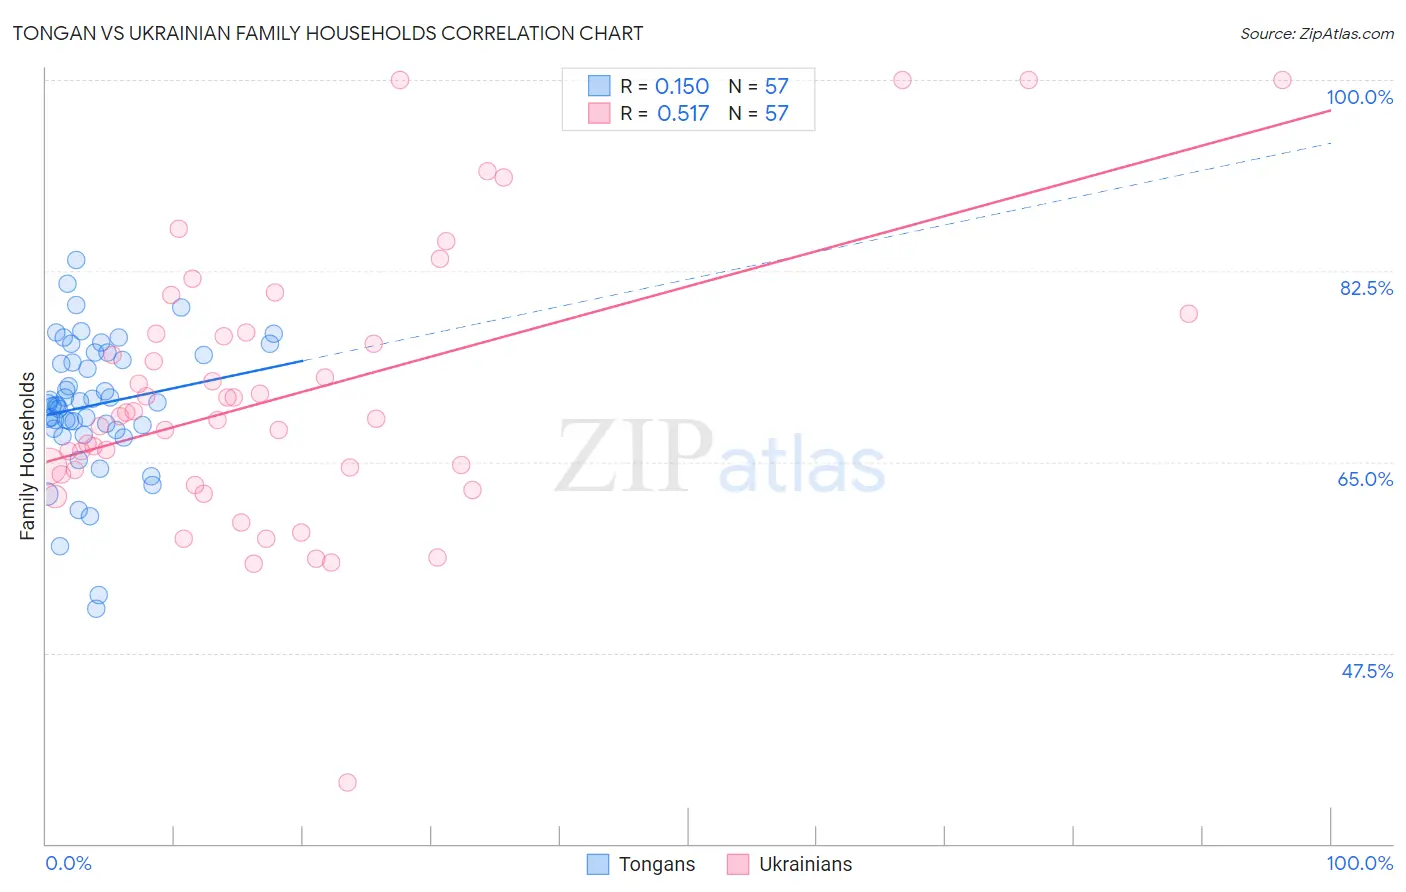
Tongan vs Ukrainian Family Households Correlation Chart
The statistical analysis conducted on geographies consisting of 102,870,916 people shows a poor positive correlation between the proportion of Tongans and percentage of family households in the United States with a correlation coefficient (R) of 0.150 and weighted average of 69.6%. Similarly, the statistical analysis conducted on geographies consisting of 448,323,660 people shows a substantial positive correlation between the proportion of Ukrainians and percentage of family households in the United States with a correlation coefficient (R) of 0.517 and weighted average of 64.2%, a difference of 8.5%.
Family Households Correlation Summary
| Measurement | Tongan | Ukrainian |
| Minimum | 51.6% | 35.6% |
| Maximum | 83.5% | 100.0% |
| Range | 31.9% | 64.4% |
| Mean | 70.2% | 71.3% |
| Median | 70.4% | 69.2% |
| Interquartile 25% (IQ1) | 68.0% | 64.0% |
| Interquartile 75% (IQ3) | 74.9% | 76.8% |
| Interquartile Range (IQR) | 7.0% | 12.8% |
| Standard Deviation (Sample) | 6.3% | 12.5% |
| Standard Deviation (Population) | 6.2% | 12.4% |
Similar Demographics by Family Households
Demographics Similar to Tongans by Family Households
In terms of family households, the demographic groups most similar to Tongans are Yakama (69.3%, a difference of 0.44%), Yuman (69.3%, a difference of 0.47%), Immigrants from Mexico (69.1%, a difference of 0.71%), Mexican (69.0%, a difference of 0.92%), and Immigrants from Fiji (68.8%, a difference of 1.2%).
| Demographics | Rating | Rank | Family Households |
| Yup'ik | 100 /100 | #1 | Exceptional 72.4% |
| Spanish American Indians | 100.0 /100 | #2 | Exceptional 71.2% |
| Tongans | 100.0 /100 | #3 | Exceptional 69.6% |
| Yakama | 100.0 /100 | #4 | Exceptional 69.3% |
| Yuman | 100.0 /100 | #5 | Exceptional 69.3% |
| Immigrants | Mexico | 100.0 /100 | #6 | Exceptional 69.1% |
| Mexicans | 100.0 /100 | #7 | Exceptional 69.0% |
| Immigrants | Fiji | 100.0 /100 | #8 | Exceptional 68.8% |
| Native Hawaiians | 100.0 /100 | #9 | Exceptional 68.4% |
| Immigrants | Philippines | 100.0 /100 | #10 | Exceptional 68.3% |
| Immigrants | Central America | 100.0 /100 | #11 | Exceptional 68.3% |
| Koreans | 100.0 /100 | #12 | Exceptional 68.3% |
| Pueblo | 100.0 /100 | #13 | Exceptional 68.2% |
| Immigrants | Cuba | 100.0 /100 | #14 | Exceptional 68.2% |
| Assyrians/Chaldeans/Syriacs | 100.0 /100 | #15 | Exceptional 68.2% |
Demographics Similar to Ukrainians by Family Households
In terms of family households, the demographic groups most similar to Ukrainians are Immigrants from Honduras (64.2%, a difference of 0.0%), Immigrants from Trinidad and Tobago (64.2%, a difference of 0.0%), Creek (64.2%, a difference of 0.010%), Puerto Rican (64.2%, a difference of 0.020%), and Immigrants from Ukraine (64.2%, a difference of 0.050%).
| Demographics | Rating | Rank | Family Households |
| Bangladeshis | 44.3 /100 | #175 | Average 64.3% |
| Vietnamese | 43.6 /100 | #176 | Average 64.2% |
| Immigrants | Micronesia | 42.3 /100 | #177 | Average 64.2% |
| Jamaicans | 40.6 /100 | #178 | Average 64.2% |
| Immigrants | Ukraine | 38.2 /100 | #179 | Fair 64.2% |
| Immigrants | Honduras | 35.0 /100 | #180 | Fair 64.2% |
| Immigrants | Trinidad and Tobago | 34.9 /100 | #181 | Fair 64.2% |
| Ukrainians | 34.6 /100 | #182 | Fair 64.2% |
| Creek | 34.1 /100 | #183 | Fair 64.2% |
| Puerto Ricans | 33.4 /100 | #184 | Fair 64.2% |
| Immigrants | Iran | 30.4 /100 | #185 | Fair 64.1% |
| Spanish Americans | 30.1 /100 | #186 | Fair 64.1% |
| Northern Europeans | 28.2 /100 | #187 | Fair 64.1% |
| Paraguayans | 26.7 /100 | #188 | Fair 64.1% |
| Immigrants | Western Asia | 25.3 /100 | #189 | Fair 64.1% |