Scottish vs Austrian Single Mother Households
COMPARE
Scottish
Austrian
Single Mother Households
Single Mother Households Comparison
Scottish
Austrians
5.8%
SINGLE MOTHER HOUSEHOLDS
96.2/ 100
METRIC RATING
103rd/ 347
METRIC RANK
5.7%
SINGLE MOTHER HOUSEHOLDS
96.4/ 100
METRIC RATING
96th/ 347
METRIC RANK
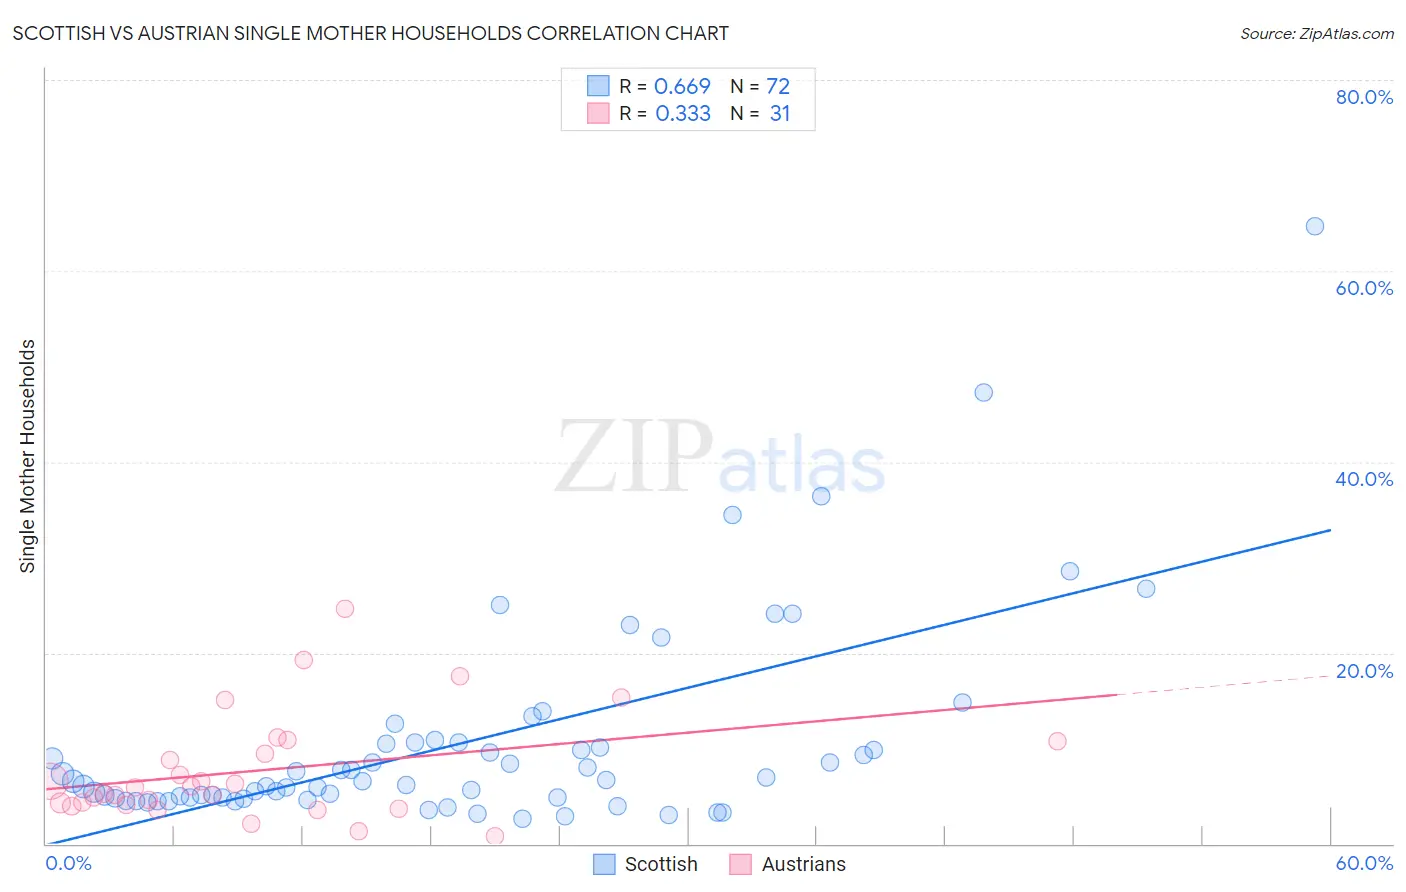
Scottish vs Austrian Single Mother Households Correlation Chart
The statistical analysis conducted on geographies consisting of 561,711,947 people shows a significant positive correlation between the proportion of Scottish and percentage of single mother households in the United States with a correlation coefficient (R) of 0.669 and weighted average of 5.8%. Similarly, the statistical analysis conducted on geographies consisting of 449,998,235 people shows a mild positive correlation between the proportion of Austrians and percentage of single mother households in the United States with a correlation coefficient (R) of 0.333 and weighted average of 5.7%, a difference of 0.21%.
Single Mother Households Correlation Summary
| Measurement | Scottish | Austrian |
| Minimum | 2.6% | 0.83% |
| Maximum | 64.7% | 24.6% |
| Range | 62.1% | 23.8% |
| Mean | 10.6% | 7.7% |
| Median | 6.6% | 5.8% |
| Interquartile 25% (IQ1) | 4.8% | 4.0% |
| Interquartile 75% (IQ3) | 10.5% | 10.7% |
| Interquartile Range (IQR) | 5.7% | 6.7% |
| Standard Deviation (Sample) | 10.9% | 5.6% |
| Standard Deviation (Population) | 10.8% | 5.5% |
Demographics Similar to Scottish and Austrians by Single Mother Households
In terms of single mother households, the demographic groups most similar to Scottish are Northern European (5.8%, a difference of 0.010%), German (5.8%, a difference of 0.020%), English (5.8%, a difference of 0.020%), Scandinavian (5.8%, a difference of 0.050%), and Immigrants from Poland (5.8%, a difference of 0.070%). Similarly, the demographic groups most similar to Austrians are Tlingit-Haida (5.7%, a difference of 0.050%), Immigrants from South Africa (5.7%, a difference of 0.090%), Slovak (5.7%, a difference of 0.15%), Immigrants from Poland (5.8%, a difference of 0.15%), and Scandinavian (5.8%, a difference of 0.16%).
| Demographics | Rating | Rank | Single Mother Households |
| Ukrainians | 97.2 /100 | #89 | Exceptional 5.7% |
| Immigrants | Indonesia | 97.2 /100 | #90 | Exceptional 5.7% |
| Europeans | 97.0 /100 | #91 | Exceptional 5.7% |
| Immigrants | Western Asia | 96.7 /100 | #92 | Exceptional 5.7% |
| Serbians | 96.7 /100 | #93 | Exceptional 5.7% |
| Basques | 96.7 /100 | #94 | Exceptional 5.7% |
| Slovaks | 96.6 /100 | #95 | Exceptional 5.7% |
| Austrians | 96.4 /100 | #96 | Exceptional 5.7% |
| Tlingit-Haida | 96.4 /100 | #97 | Exceptional 5.7% |
| Immigrants | South Africa | 96.3 /100 | #98 | Exceptional 5.7% |
| Immigrants | Poland | 96.3 /100 | #99 | Exceptional 5.8% |
| Scandinavians | 96.2 /100 | #100 | Exceptional 5.8% |
| Germans | 96.2 /100 | #101 | Exceptional 5.8% |
| English | 96.2 /100 | #102 | Exceptional 5.8% |
| Scottish | 96.2 /100 | #103 | Exceptional 5.8% |
| Northern Europeans | 96.2 /100 | #104 | Exceptional 5.8% |
| Taiwanese | 96.1 /100 | #105 | Exceptional 5.8% |
| Immigrants | Ukraine | 95.9 /100 | #106 | Exceptional 5.8% |
| Paraguayans | 95.8 /100 | #107 | Exceptional 5.8% |
| Immigrants | Italy | 95.8 /100 | #108 | Exceptional 5.8% |
| Immigrants | Western Europe | 95.7 /100 | #109 | Exceptional 5.8% |