African vs Asian Single Father Households
COMPARE
African
Asian
Single Father Households
Single Father Households Comparison
Africans
Asians
2.5%
SINGLE FATHER HOUSEHOLDS
6.3/ 100
METRIC RATING
234th/ 347
METRIC RANK
2.1%
SINGLE FATHER HOUSEHOLDS
99.6/ 100
METRIC RATING
86th/ 347
METRIC RANK
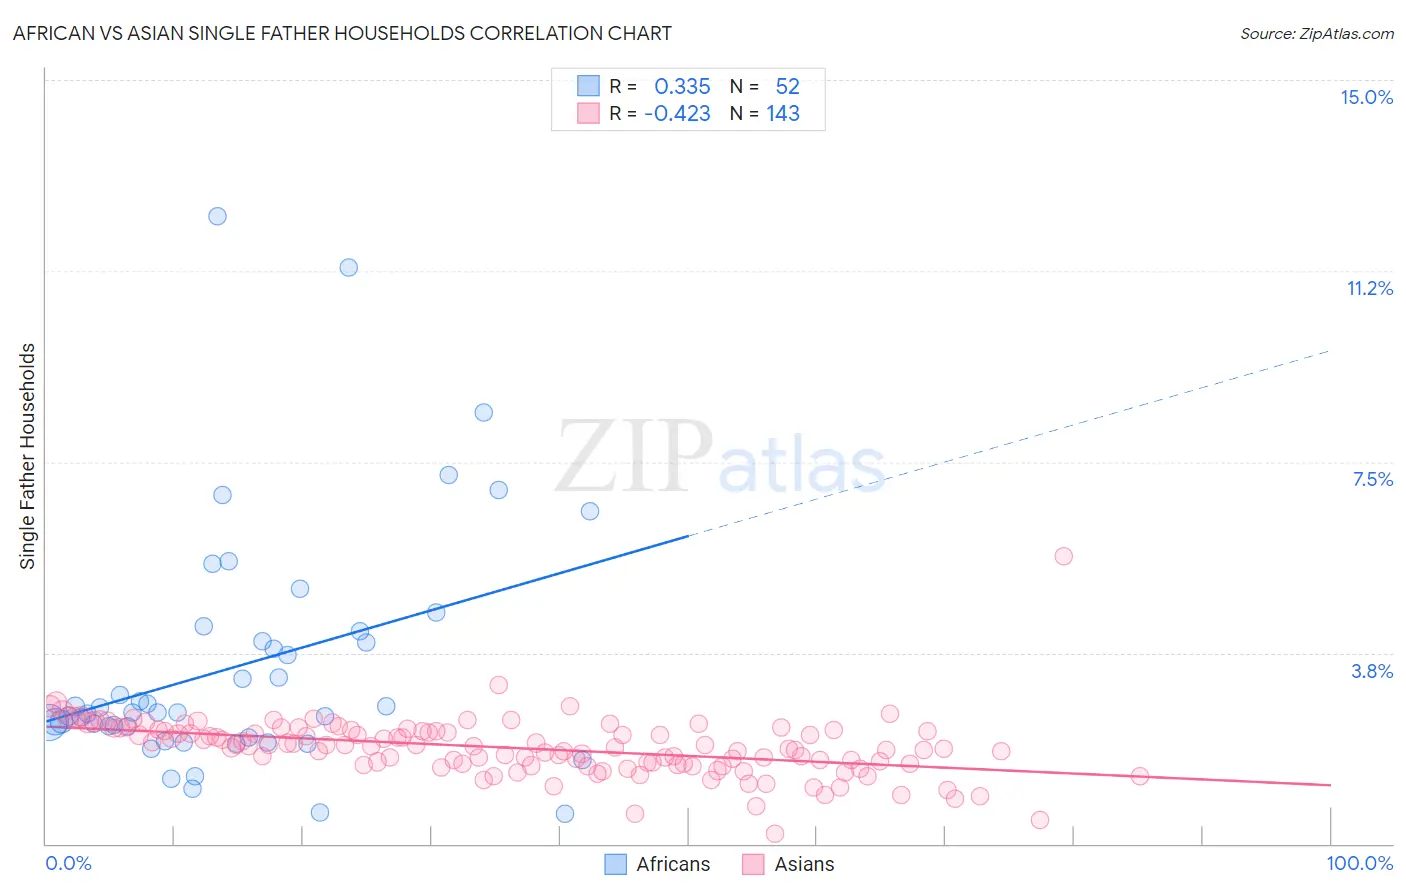
African vs Asian Single Father Households Correlation Chart
The statistical analysis conducted on geographies consisting of 464,994,675 people shows a mild positive correlation between the proportion of Africans and percentage of single father households in the United States with a correlation coefficient (R) of 0.335 and weighted average of 2.5%. Similarly, the statistical analysis conducted on geographies consisting of 539,811,945 people shows a moderate negative correlation between the proportion of Asians and percentage of single father households in the United States with a correlation coefficient (R) of -0.423 and weighted average of 2.1%, a difference of 16.9%.
Single Father Households Correlation Summary
| Measurement | African | Asian |
| Minimum | 0.60% | 0.19% |
| Maximum | 12.3% | 5.7% |
| Range | 11.7% | 5.5% |
| Mean | 3.5% | 1.9% |
| Median | 2.6% | 1.9% |
| Interquartile 25% (IQ1) | 2.2% | 1.6% |
| Interquartile 75% (IQ3) | 4.1% | 2.2% |
| Interquartile Range (IQR) | 1.9% | 0.67% |
| Standard Deviation (Sample) | 2.4% | 0.58% |
| Standard Deviation (Population) | 2.4% | 0.58% |
Similar Demographics by Single Father Households
Demographics Similar to Africans by Single Father Households
In terms of single father households, the demographic groups most similar to Africans are Immigrants (2.5%, a difference of 0.020%), Cajun (2.5%, a difference of 0.070%), Sierra Leonean (2.5%, a difference of 0.12%), Immigrants from Sierra Leone (2.5%, a difference of 0.15%), and Immigrants from Oceania (2.5%, a difference of 0.16%).
| Demographics | Rating | Rank | Single Father Households |
| Americans | 9.3 /100 | #227 | Tragic 2.4% |
| Immigrants | Ghana | 9.1 /100 | #228 | Tragic 2.4% |
| Immigrants | Zaire | 8.6 /100 | #229 | Tragic 2.4% |
| Sub-Saharan Africans | 8.3 /100 | #230 | Tragic 2.4% |
| Immigrants | Nonimmigrants | 7.6 /100 | #231 | Tragic 2.4% |
| Pennsylvania Germans | 7.3 /100 | #232 | Tragic 2.4% |
| Immigrants | Western Africa | 7.0 /100 | #233 | Tragic 2.4% |
| Africans | 6.3 /100 | #234 | Tragic 2.5% |
| Immigrants | Immigrants | 6.3 /100 | #235 | Tragic 2.5% |
| Cajuns | 6.1 /100 | #236 | Tragic 2.5% |
| Sierra Leoneans | 5.9 /100 | #237 | Tragic 2.5% |
| Immigrants | Sierra Leone | 5.8 /100 | #238 | Tragic 2.5% |
| Immigrants | Oceania | 5.8 /100 | #239 | Tragic 2.5% |
| Immigrants | Dominica | 4.8 /100 | #240 | Tragic 2.5% |
| Portuguese | 4.1 /100 | #241 | Tragic 2.5% |
Demographics Similar to Asians by Single Father Households
In terms of single father households, the demographic groups most similar to Asians are Immigrants from Hungary (2.1%, a difference of 0.080%), Carpatho Rusyn (2.1%, a difference of 0.12%), Greek (2.1%, a difference of 0.42%), New Zealander (2.1%, a difference of 0.43%), and Armenian (2.1%, a difference of 0.48%).
| Demographics | Rating | Rank | Single Father Households |
| Immigrants | Asia | 99.7 /100 | #79 | Exceptional 2.1% |
| Immigrants | South Africa | 99.7 /100 | #80 | Exceptional 2.1% |
| Armenians | 99.7 /100 | #81 | Exceptional 2.1% |
| New Zealanders | 99.7 /100 | #82 | Exceptional 2.1% |
| Greeks | 99.7 /100 | #83 | Exceptional 2.1% |
| Carpatho Rusyns | 99.6 /100 | #84 | Exceptional 2.1% |
| Immigrants | Hungary | 99.6 /100 | #85 | Exceptional 2.1% |
| Asians | 99.6 /100 | #86 | Exceptional 2.1% |
| Lithuanians | 99.5 /100 | #87 | Exceptional 2.1% |
| Bhutanese | 99.5 /100 | #88 | Exceptional 2.1% |
| Immigrants | Armenia | 99.5 /100 | #89 | Exceptional 2.1% |
| Immigrants | Pakistan | 99.5 /100 | #90 | Exceptional 2.1% |
| Immigrants | Guyana | 99.4 /100 | #91 | Exceptional 2.1% |
| Romanians | 99.4 /100 | #92 | Exceptional 2.1% |
| Croatians | 99.3 /100 | #93 | Exceptional 2.1% |