Tohono O'odham vs Immigrants from El Salvador Births to Unmarried Women
COMPARE
Tohono O'odham
Immigrants from El Salvador
Births to Unmarried Women
Births to Unmarried Women Comparison
Tohono O'odham
Immigrants from El Salvador
49.8%
BIRTHS TO UNMARRIED WOMEN
0.0/ 100
METRIC RATING
340th/ 347
METRIC RANK
36.4%
BIRTHS TO UNMARRIED WOMEN
0.2/ 100
METRIC RATING
259th/ 347
METRIC RANK
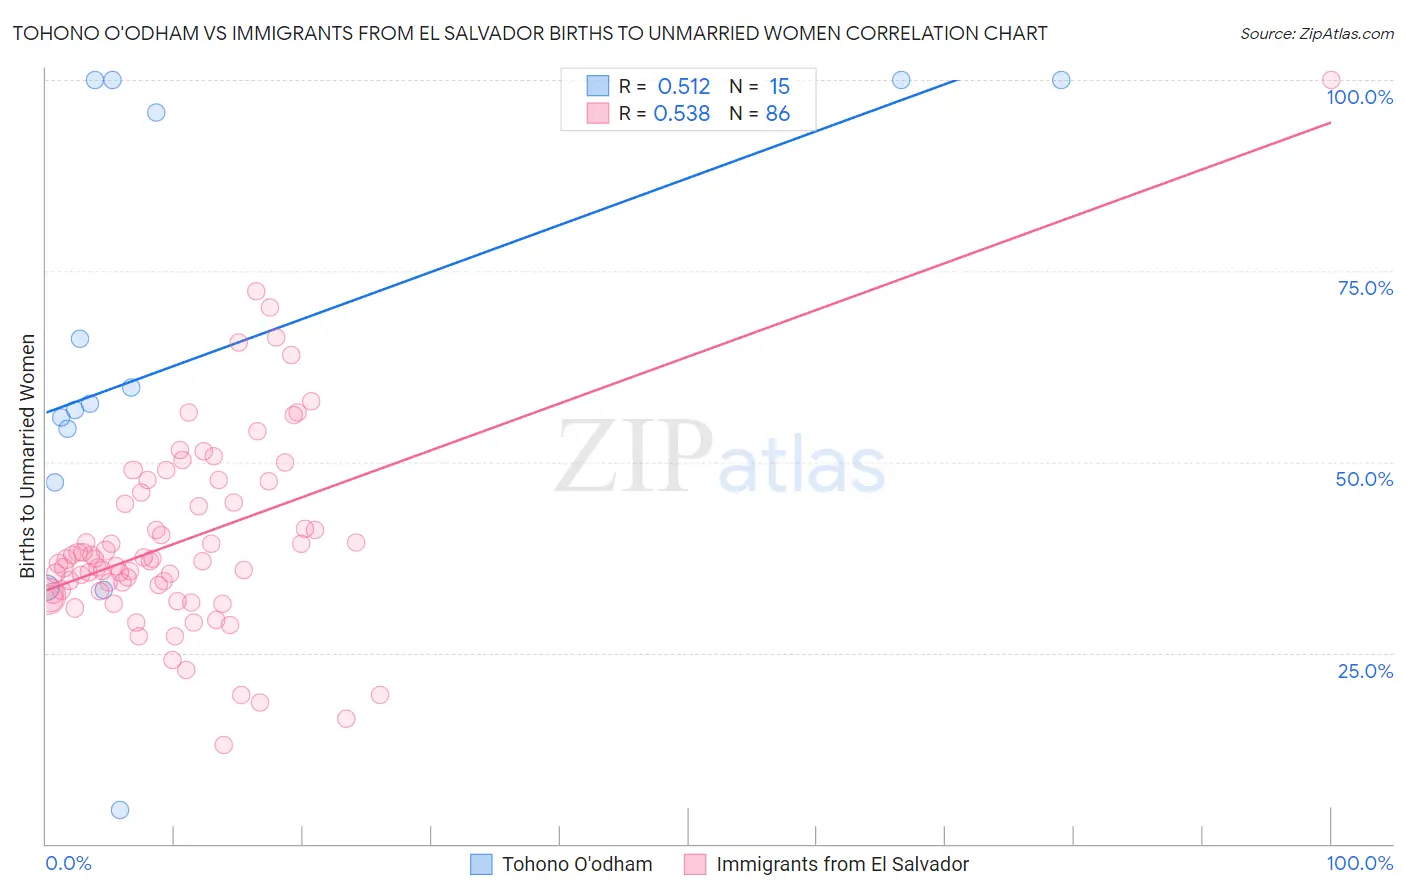
Tohono O'odham vs Immigrants from El Salvador Births to Unmarried Women Correlation Chart
The statistical analysis conducted on geographies consisting of 58,143,081 people shows a substantial positive correlation between the proportion of Tohono O'odham and percentage of births to unmarried women in the United States with a correlation coefficient (R) of 0.512 and weighted average of 49.8%. Similarly, the statistical analysis conducted on geographies consisting of 341,352,792 people shows a substantial positive correlation between the proportion of Immigrants from El Salvador and percentage of births to unmarried women in the United States with a correlation coefficient (R) of 0.538 and weighted average of 36.4%, a difference of 36.8%.
Births to Unmarried Women Correlation Summary
| Measurement | Tohono O'odham | Immigrants from El Salvador |
| Minimum | 4.5% | 12.9% |
| Maximum | 100.0% | 100.0% |
| Range | 95.5% | 87.1% |
| Mean | 64.3% | 39.8% |
| Median | 57.6% | 37.1% |
| Interquartile 25% (IQ1) | 47.3% | 33.0% |
| Interquartile 75% (IQ3) | 100.0% | 45.9% |
| Interquartile Range (IQR) | 52.7% | 12.9% |
| Standard Deviation (Sample) | 29.5% | 13.2% |
| Standard Deviation (Population) | 28.5% | 13.2% |
Similar Demographics by Births to Unmarried Women
Demographics Similar to Tohono O'odham by Births to Unmarried Women
In terms of births to unmarried women, the demographic groups most similar to Tohono O'odham are Hopi (50.8%, a difference of 1.9%), Menominee (51.1%, a difference of 2.5%), Pima (51.5%, a difference of 3.3%), Navajo (51.5%, a difference of 3.3%), and Lumbee (48.2%, a difference of 3.4%).
| Demographics | Rating | Rank | Births to Unmarried Women |
| Blacks/African Americans | 0.0 /100 | #333 | Tragic 44.3% |
| Yuman | 0.0 /100 | #334 | Tragic 44.4% |
| Colville | 0.0 /100 | #335 | Tragic 45.3% |
| Puerto Ricans | 0.0 /100 | #336 | Tragic 45.7% |
| Houma | 0.0 /100 | #337 | Tragic 46.6% |
| Arapaho | 0.0 /100 | #338 | Tragic 47.1% |
| Lumbee | 0.0 /100 | #339 | Tragic 48.2% |
| Tohono O'odham | 0.0 /100 | #340 | Tragic 49.8% |
| Hopi | 0.0 /100 | #341 | Tragic 50.8% |
| Menominee | 0.0 /100 | #342 | Tragic 51.1% |
| Pima | 0.0 /100 | #343 | Tragic 51.5% |
| Navajo | 0.0 /100 | #344 | Tragic 51.5% |
| Inupiat | 0.0 /100 | #345 | Tragic 52.1% |
| Pueblo | 0.0 /100 | #346 | Tragic 53.7% |
| Yup'ik | 0.0 /100 | #347 | Tragic 56.4% |
Demographics Similar to Immigrants from El Salvador by Births to Unmarried Women
In terms of births to unmarried women, the demographic groups most similar to Immigrants from El Salvador are American (36.4%, a difference of 0.050%), Ottawa (36.5%, a difference of 0.12%), Trinidadian and Tobagonian (36.5%, a difference of 0.12%), Immigrants from Grenada (36.3%, a difference of 0.33%), and Chickasaw (36.3%, a difference of 0.36%).
| Demographics | Rating | Rank | Births to Unmarried Women |
| Salvadorans | 0.3 /100 | #252 | Tragic 36.0% |
| Immigrants | Portugal | 0.2 /100 | #253 | Tragic 36.2% |
| Potawatomi | 0.2 /100 | #254 | Tragic 36.2% |
| Chickasaw | 0.2 /100 | #255 | Tragic 36.3% |
| Immigrants | Trinidad and Tobago | 0.2 /100 | #256 | Tragic 36.3% |
| Immigrants | Grenada | 0.2 /100 | #257 | Tragic 36.3% |
| Americans | 0.2 /100 | #258 | Tragic 36.4% |
| Immigrants | El Salvador | 0.2 /100 | #259 | Tragic 36.4% |
| Ottawa | 0.2 /100 | #260 | Tragic 36.5% |
| Trinidadians and Tobagonians | 0.2 /100 | #261 | Tragic 36.5% |
| French American Indians | 0.1 /100 | #262 | Tragic 36.6% |
| Nicaraguans | 0.1 /100 | #263 | Tragic 36.6% |
| Sub-Saharan Africans | 0.1 /100 | #264 | Tragic 36.7% |
| Cherokee | 0.1 /100 | #265 | Tragic 36.7% |
| Immigrants | Senegal | 0.1 /100 | #266 | Tragic 36.7% |