Tohono O'odham vs Eastern European Births to Unmarried Women
COMPARE
Tohono O'odham
Eastern European
Births to Unmarried Women
Births to Unmarried Women Comparison
Tohono O'odham
Eastern Europeans
49.8%
BIRTHS TO UNMARRIED WOMEN
0.0/ 100
METRIC RATING
340th/ 347
METRIC RANK
27.7%
BIRTHS TO UNMARRIED WOMEN
99.5/ 100
METRIC RATING
48th/ 347
METRIC RANK
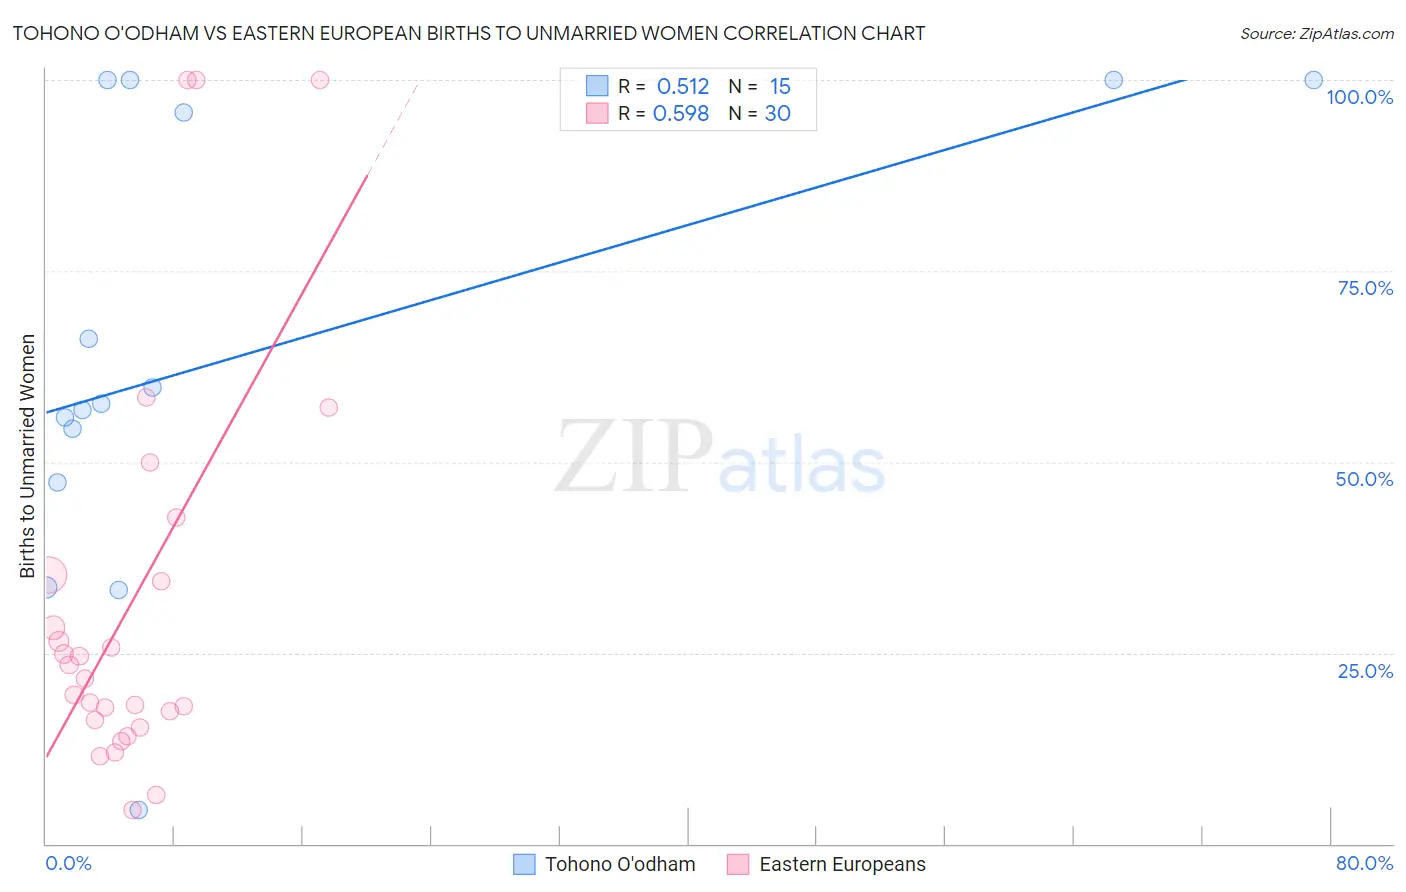
Tohono O'odham vs Eastern European Births to Unmarried Women Correlation Chart
The statistical analysis conducted on geographies consisting of 58,143,081 people shows a substantial positive correlation between the proportion of Tohono O'odham and percentage of births to unmarried women in the United States with a correlation coefficient (R) of 0.512 and weighted average of 49.8%. Similarly, the statistical analysis conducted on geographies consisting of 419,649,713 people shows a substantial positive correlation between the proportion of Eastern Europeans and percentage of births to unmarried women in the United States with a correlation coefficient (R) of 0.598 and weighted average of 27.7%, a difference of 79.7%.
Births to Unmarried Women Correlation Summary
| Measurement | Tohono O'odham | Eastern European |
| Minimum | 4.5% | 4.4% |
| Maximum | 100.0% | 100.0% |
| Range | 95.5% | 95.6% |
| Mean | 64.3% | 31.8% |
| Median | 57.6% | 22.6% |
| Interquartile 25% (IQ1) | 47.3% | 16.3% |
| Interquartile 75% (IQ3) | 100.0% | 35.2% |
| Interquartile Range (IQR) | 52.7% | 18.9% |
| Standard Deviation (Sample) | 29.5% | 26.7% |
| Standard Deviation (Population) | 28.5% | 26.2% |
Similar Demographics by Births to Unmarried Women
Demographics Similar to Tohono O'odham by Births to Unmarried Women
In terms of births to unmarried women, the demographic groups most similar to Tohono O'odham are Hopi (50.8%, a difference of 1.9%), Menominee (51.1%, a difference of 2.5%), Pima (51.5%, a difference of 3.3%), Navajo (51.5%, a difference of 3.3%), and Lumbee (48.2%, a difference of 3.4%).
| Demographics | Rating | Rank | Births to Unmarried Women |
| Blacks/African Americans | 0.0 /100 | #333 | Tragic 44.3% |
| Yuman | 0.0 /100 | #334 | Tragic 44.4% |
| Colville | 0.0 /100 | #335 | Tragic 45.3% |
| Puerto Ricans | 0.0 /100 | #336 | Tragic 45.7% |
| Houma | 0.0 /100 | #337 | Tragic 46.6% |
| Arapaho | 0.0 /100 | #338 | Tragic 47.1% |
| Lumbee | 0.0 /100 | #339 | Tragic 48.2% |
| Tohono O'odham | 0.0 /100 | #340 | Tragic 49.8% |
| Hopi | 0.0 /100 | #341 | Tragic 50.8% |
| Menominee | 0.0 /100 | #342 | Tragic 51.1% |
| Pima | 0.0 /100 | #343 | Tragic 51.5% |
| Navajo | 0.0 /100 | #344 | Tragic 51.5% |
| Inupiat | 0.0 /100 | #345 | Tragic 52.1% |
| Pueblo | 0.0 /100 | #346 | Tragic 53.7% |
| Yup'ik | 0.0 /100 | #347 | Tragic 56.4% |
Demographics Similar to Eastern Europeans by Births to Unmarried Women
In terms of births to unmarried women, the demographic groups most similar to Eastern Europeans are Immigrants from Lithuania (27.7%, a difference of 0.010%), Hmong (27.7%, a difference of 0.010%), Latvian (27.7%, a difference of 0.060%), Immigrants from Indonesia (27.7%, a difference of 0.15%), and Immigrants from Greece (27.8%, a difference of 0.19%).
| Demographics | Rating | Rank | Births to Unmarried Women |
| Iraqis | 99.6 /100 | #41 | Exceptional 27.6% |
| Immigrants | Eastern Europe | 99.6 /100 | #42 | Exceptional 27.6% |
| Immigrants | Bulgaria | 99.6 /100 | #43 | Exceptional 27.6% |
| Immigrants | Indonesia | 99.5 /100 | #44 | Exceptional 27.7% |
| Latvians | 99.5 /100 | #45 | Exceptional 27.7% |
| Immigrants | Lithuania | 99.5 /100 | #46 | Exceptional 27.7% |
| Hmong | 99.5 /100 | #47 | Exceptional 27.7% |
| Eastern Europeans | 99.5 /100 | #48 | Exceptional 27.7% |
| Immigrants | Greece | 99.4 /100 | #49 | Exceptional 27.8% |
| Maltese | 99.4 /100 | #50 | Exceptional 27.8% |
| Macedonians | 99.4 /100 | #51 | Exceptional 27.9% |
| Bhutanese | 99.4 /100 | #52 | Exceptional 27.9% |
| Immigrants | Romania | 99.4 /100 | #53 | Exceptional 27.9% |
| Afghans | 99.4 /100 | #54 | Exceptional 27.9% |
| Mongolians | 99.3 /100 | #55 | Exceptional 27.9% |