Immigrants from Chile vs Nonimmigrants Family Households with Children
COMPARE
Immigrants from Chile
Nonimmigrants
Family Households with Children
Family Households with Children Comparison
Immigrants from Chile
Nonimmigrants
27.7%
FAMILY HOUSEHOLDS WITH CHILDREN
79.5/ 100
METRIC RATING
145th/ 347
METRIC RANK
27.5%
FAMILY HOUSEHOLDS WITH CHILDREN
61.2/ 100
METRIC RATING
166th/ 347
METRIC RANK
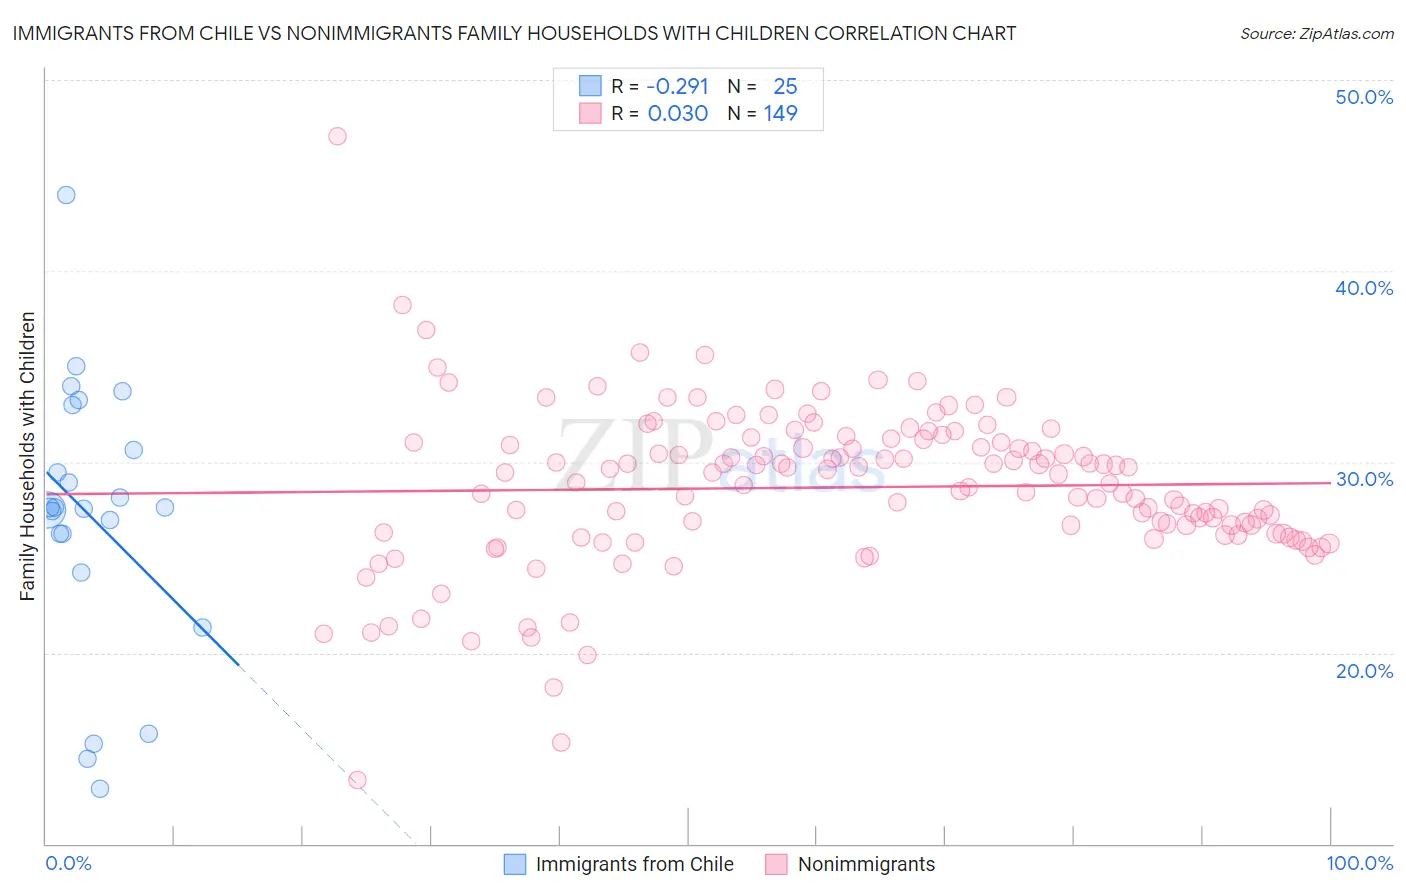
Immigrants from Chile vs Nonimmigrants Family Households with Children Correlation Chart
The statistical analysis conducted on geographies consisting of 218,581,482 people shows a weak negative correlation between the proportion of Immigrants from Chile and percentage of family households with children in the United States with a correlation coefficient (R) of -0.291 and weighted average of 27.7%. Similarly, the statistical analysis conducted on geographies consisting of 583,873,030 people shows no correlation between the proportion of Nonimmigrants and percentage of family households with children in the United States with a correlation coefficient (R) of 0.030 and weighted average of 27.5%, a difference of 0.49%.
Family Households with Children Correlation Summary
| Measurement | Immigrants from Chile | Nonimmigrants |
| Minimum | 12.9% | 13.3% |
| Maximum | 44.0% | 47.1% |
| Range | 31.1% | 33.7% |
| Mean | 27.1% | 28.7% |
| Median | 27.6% | 29.3% |
| Interquartile 25% (IQ1) | 25.2% | 26.2% |
| Interquartile 75% (IQ3) | 31.8% | 31.1% |
| Interquartile Range (IQR) | 6.6% | 4.9% |
| Standard Deviation (Sample) | 7.1% | 4.2% |
| Standard Deviation (Population) | 7.0% | 4.2% |
Similar Demographics by Family Households with Children
Demographics Similar to Immigrants from Chile by Family Households with Children
In terms of family households with children, the demographic groups most similar to Immigrants from Chile are Basque (27.7%, a difference of 0.0%), Brazilian (27.7%, a difference of 0.010%), Immigrants from Moldova (27.6%, a difference of 0.010%), Osage (27.6%, a difference of 0.020%), and Menominee (27.6%, a difference of 0.020%).
| Demographics | Rating | Rank | Family Households with Children |
| Uruguayans | 83.2 /100 | #138 | Excellent 27.7% |
| Vietnamese | 82.6 /100 | #139 | Excellent 27.7% |
| Spanish | 81.8 /100 | #140 | Excellent 27.7% |
| Immigrants | Eastern Asia | 81.7 /100 | #141 | Excellent 27.7% |
| Swiss | 81.4 /100 | #142 | Excellent 27.7% |
| Immigrants | Eastern Africa | 80.2 /100 | #143 | Excellent 27.7% |
| Brazilians | 79.6 /100 | #144 | Good 27.7% |
| Immigrants | Chile | 79.5 /100 | #145 | Good 27.7% |
| Basques | 79.5 /100 | #146 | Good 27.7% |
| Immigrants | Moldova | 79.1 /100 | #147 | Good 27.6% |
| Osage | 79.0 /100 | #148 | Good 27.6% |
| Menominee | 78.9 /100 | #149 | Good 27.6% |
| Argentineans | 78.5 /100 | #150 | Good 27.6% |
| Portuguese | 77.8 /100 | #151 | Good 27.6% |
| Ethiopians | 77.0 /100 | #152 | Good 27.6% |
Demographics Similar to Nonimmigrants by Family Households with Children
In terms of family households with children, the demographic groups most similar to Nonimmigrants are Immigrants from South Africa (27.5%, a difference of 0.0%), Dominican (27.5%, a difference of 0.0%), Immigrants from Kuwait (27.5%, a difference of 0.010%), Immigrants from Hong Kong (27.5%, a difference of 0.090%), and Czech (27.5%, a difference of 0.10%).
| Demographics | Rating | Rank | Family Households with Children |
| Mongolians | 70.7 /100 | #159 | Good 27.6% |
| Sub-Saharan Africans | 67.5 /100 | #160 | Good 27.6% |
| Alaskan Athabascans | 67.1 /100 | #161 | Good 27.6% |
| Immigrants | Bangladesh | 67.0 /100 | #162 | Good 27.6% |
| Czechs | 65.3 /100 | #163 | Good 27.5% |
| Immigrants | Hong Kong | 64.9 /100 | #164 | Good 27.5% |
| Immigrants | South Africa | 61.3 /100 | #165 | Good 27.5% |
| Immigrants | Nonimmigrants | 61.2 /100 | #166 | Good 27.5% |
| Dominicans | 61.1 /100 | #167 | Good 27.5% |
| Immigrants | Kuwait | 60.9 /100 | #168 | Good 27.5% |
| Seminole | 56.9 /100 | #169 | Average 27.5% |
| Cherokee | 56.7 /100 | #170 | Average 27.5% |
| Blackfeet | 54.3 /100 | #171 | Average 27.5% |
| Israelis | 53.9 /100 | #172 | Average 27.5% |
| Immigrants | Argentina | 52.2 /100 | #173 | Average 27.5% |