Immigrants from Philippines vs Nonimmigrants Family Households with Children

COMPARE

Immigrants from Philippines
Race
Ancestry
AfghanAfricanAlaska NativeAlaskan AthabascanAlbanianAleutAlsatianAmericanApacheArabArapahoArgentineanArmenianAssyrian/Chaldean/SyriacAustralianAustrianBahamianBangladeshiBarbadianBasqueBelgianBelizeanBermudanBhutaneseBlackfeetBolivianBrazilianBritishBritish West IndianBulgarianBurmeseCajunCambodianCanadianCape VerdeanCarpatho RusynCelticCentral AmericanCentral American IndianCherokeeCheyenneChickasawChileanChineseChippewaChoctawColombianColvilleComancheCosta RicanCreeCreekCroatianCrowCubanCypriotCzechCzechoslovakianDanishDelawareDominicanDutchDutch West IndianEastern EuropeanEcuadorianEgyptianEnglishEstonianEthiopianEuropeanFijianFilipinoFinnishFrenchFrench American IndianFrench CanadianGermanGerman RussianGhanaianGreekGuamanian/ChamorroGuatemalanGuyaneseHaitianHmongHonduranHopiHoumaHungarianIcelanderIndian (Asian)IndonesianInupiatIranianIraqiIrishIroquoisIsraeliItalianJamaicanJapaneseJordanianKenyanKiowaKoreanLaotianLatvianLebaneseLiberianLithuanianLumbeeLuxembourgerMacedonianMalaysianMalteseMarshalleseMenomineeMexicanMexican American IndianMongolianMoroccanNative HawaiianNavajoNepaleseNew ZealanderNicaraguanNigerianNorthern EuropeanNorwegianOkinawanOsageOttawaPaiutePakistaniPalestinianPanamanianParaguayanPennsylvania GermanPeruvianPimaPolishPortuguesePotawatomiPuebloPuerto RicanPuget Sound SalishRomanianRussianSalvadoranSamoanScandinavianScotch-IrishScottishSeminoleSenegaleseSerbianShoshoneSierra LeoneanSiouxSlavicSlovakSloveneSomaliSouth AfricanSouth AmericanSouth American IndianSoviet UnionSpaniardSpanishSpanish AmericanSpanish American IndianSri LankanSubsaharan AfricanSudaneseSwedishSwissSyrianTaiwaneseThaiTlingit-HaidaTohono O'OdhamTonganTrinidadian and TobagonianTsimshianTurkishU.S. Virgin IslanderUgandanUkrainianUruguayanUteVenezuelanVietnameseWelshWest IndianYakamaYaquiYugoslavianYumanYup'ikZimbabwean
Immigration
ImmigrantsAfghanistanAfricaAlbaniaArgentinaArmeniaAsiaAustraliaAustriaBahamasBangladeshBarbadosBelarusBelgiumBelizeBoliviaBosnia and HerzegovinaBrazilBulgariaBurma/MyanmarCabo VerdeCambodiaCameroonCanadaCaribbeanCentral AmericaChileChinaColombiaCongoCosta RicaCroatiaCubaCzechoslovakiaDenmarkDominicaDominican RepublicEastern AfricaEastern AsiaEastern EuropeEcuadorEgyptEl SalvadorEnglandEritreaEthiopiaEuropeFijiFranceGermanyGhanaGreeceGrenadaGuatemalaGuyanaHaitiHondurasHong KongHungaryIndiaIndonesiaIranIraqIrelandIsraelItalyJamaicaJapanJordanKazakhstanKenyaKoreaKuwaitLaosLatin AmericaLatviaLebanonLiberiaLithuaniaMalaysiaMexicoMicronesiaMiddle AfricaMoldovaMoroccoNepalNetherlandsNicaraguaNigeriaNorth AmericaNorth MacedoniaNorthern AfricaNorthern EuropeNorwayOceaniaPakistanPanamaPeruPhilippinesPolandPortugalRomaniaRussiaSaudi ArabiaScotlandSenegalSerbiaSierra LeoneSingaporeSomaliaSouth AfricaSouth AmericaSouth Central AsiaSouth Eastern AsiaSouthern EuropeSpainSri LankaSt. Vincent and the GrenadinesSudanSwedenSwitzerlandSyriaTaiwanThailandTrinidad and TobagoTurkeyUgandaUkraineUruguayUzbekistanVenezuelaVietnamWest IndiesWestern AfricaWestern AsiaWestern EuropeYemenZaireZimbabweAzores
Nonimmigrants
Race
Ancestry
AfghanAfricanAlaska NativeAlaskan AthabascanAlbanianAleutAlsatianAmericanApacheArabArapahoArgentineanArmenianAssyrian/Chaldean/SyriacAustralianAustrianBahamianBangladeshiBarbadianBasqueBelgianBelizeanBermudanBhutaneseBlackfeetBolivianBrazilianBritishBritish West IndianBulgarianBurmeseCajunCambodianCanadianCape VerdeanCarpatho RusynCelticCentral AmericanCentral American IndianCherokeeCheyenneChickasawChileanChineseChippewaChoctawColombianColvilleComancheCosta RicanCreeCreekCroatianCrowCubanCypriotCzechCzechoslovakianDanishDelawareDominicanDutchDutch West IndianEastern EuropeanEcuadorianEgyptianEnglishEstonianEthiopianEuropeanFijianFilipinoFinnishFrenchFrench American IndianFrench CanadianGermanGerman RussianGhanaianGreekGuamanian/ChamorroGuatemalanGuyaneseHaitianHmongHonduranHopiHoumaHungarianIcelanderIndian (Asian)IndonesianInupiatIranianIraqiIrishIroquoisIsraeliItalianJamaicanJapaneseJordanianKenyanKiowaKoreanLaotianLatvianLebaneseLiberianLithuanianLumbeeLuxembourgerMacedonianMalaysianMalteseMarshalleseMenomineeMexicanMexican American IndianMongolianMoroccanNative HawaiianNavajoNepaleseNew ZealanderNicaraguanNigerianNorthern EuropeanNorwegianOkinawanOsageOttawaPaiutePakistaniPalestinianPanamanianParaguayanPennsylvania GermanPeruvianPimaPolishPortuguesePotawatomiPuebloPuerto RicanPuget Sound SalishRomanianRussianSalvadoranSamoanScandinavianScotch-IrishScottishSeminoleSenegaleseSerbianShoshoneSierra LeoneanSiouxSlavicSlovakSloveneSomaliSouth AfricanSouth AmericanSouth American IndianSoviet UnionSpaniardSpanishSpanish AmericanSpanish American IndianSri LankanSubsaharan AfricanSudaneseSwedishSwissSyrianTaiwaneseThaiTlingit-HaidaTohono O'OdhamTonganTrinidadian and TobagonianTsimshianTurkishU.S. Virgin IslanderUgandanUkrainianUruguayanUteVenezuelanVietnameseWelshWest IndianYakamaYaquiYugoslavianYumanYup'ikZimbabwean
Immigration
NonimmigrantsImmigrantsAfghanistanAfricaAlbaniaArgentinaArmeniaAsiaAustraliaAustriaBahamasBangladeshBarbadosBelarusBelgiumBelizeBoliviaBosnia and HerzegovinaBrazilBulgariaBurma/MyanmarCabo VerdeCambodiaCameroonCanadaCaribbeanCentral AmericaChileChinaColombiaCongoCosta RicaCroatiaCubaCzechoslovakiaDenmarkDominicaDominican RepublicEastern AfricaEastern AsiaEastern EuropeEcuadorEgyptEl SalvadorEnglandEritreaEthiopiaEuropeFijiFranceGermanyGhanaGreeceGrenadaGuatemalaGuyanaHaitiHondurasHong KongHungaryIndiaIndonesiaIranIraqIrelandIsraelItalyJamaicaJapanJordanKazakhstanKenyaKoreaKuwaitLaosLatin AmericaLatviaLebanonLiberiaLithuaniaMalaysiaMexicoMicronesiaMiddle AfricaMoldovaMoroccoNepalNetherlandsNicaraguaNigeriaNorth AmericaNorth MacedoniaNorthern AfricaNorthern EuropeNorwayOceaniaPakistanPanamaPeruPolandPortugalRomaniaRussiaSaudi ArabiaScotlandSenegalSerbiaSierra LeoneSingaporeSomaliaSouth AfricaSouth AmericaSouth Central AsiaSouth Eastern AsiaSouthern EuropeSpainSri LankaSt. Vincent and the GrenadinesSudanSwedenSwitzerlandSyriaTaiwanThailandTrinidad and TobagoTurkeyUgandaUkraineUruguayUzbekistanVenezuelaVietnamWest IndiesWestern AfricaWestern AsiaWestern EuropeYemenZaireZimbabweAzores
Family Households with Children
Income
Poverty
Unemployment
Labor Participation
Family Structure
Vehicle Availability
Education Level
Disability

Family Households with Children Comparison

Immigrants from Philippines

Nonimmigrants

Exceptional
Good
29.0%
FAMILY HOUSEHOLDS WITH CHILDREN
100.0/ 100
METRIC RATING
46th/ 347
METRIC RANK
27.5%
FAMILY HOUSEHOLDS WITH CHILDREN
61.2/ 100
METRIC RATING
166th/ 347
METRIC RANK

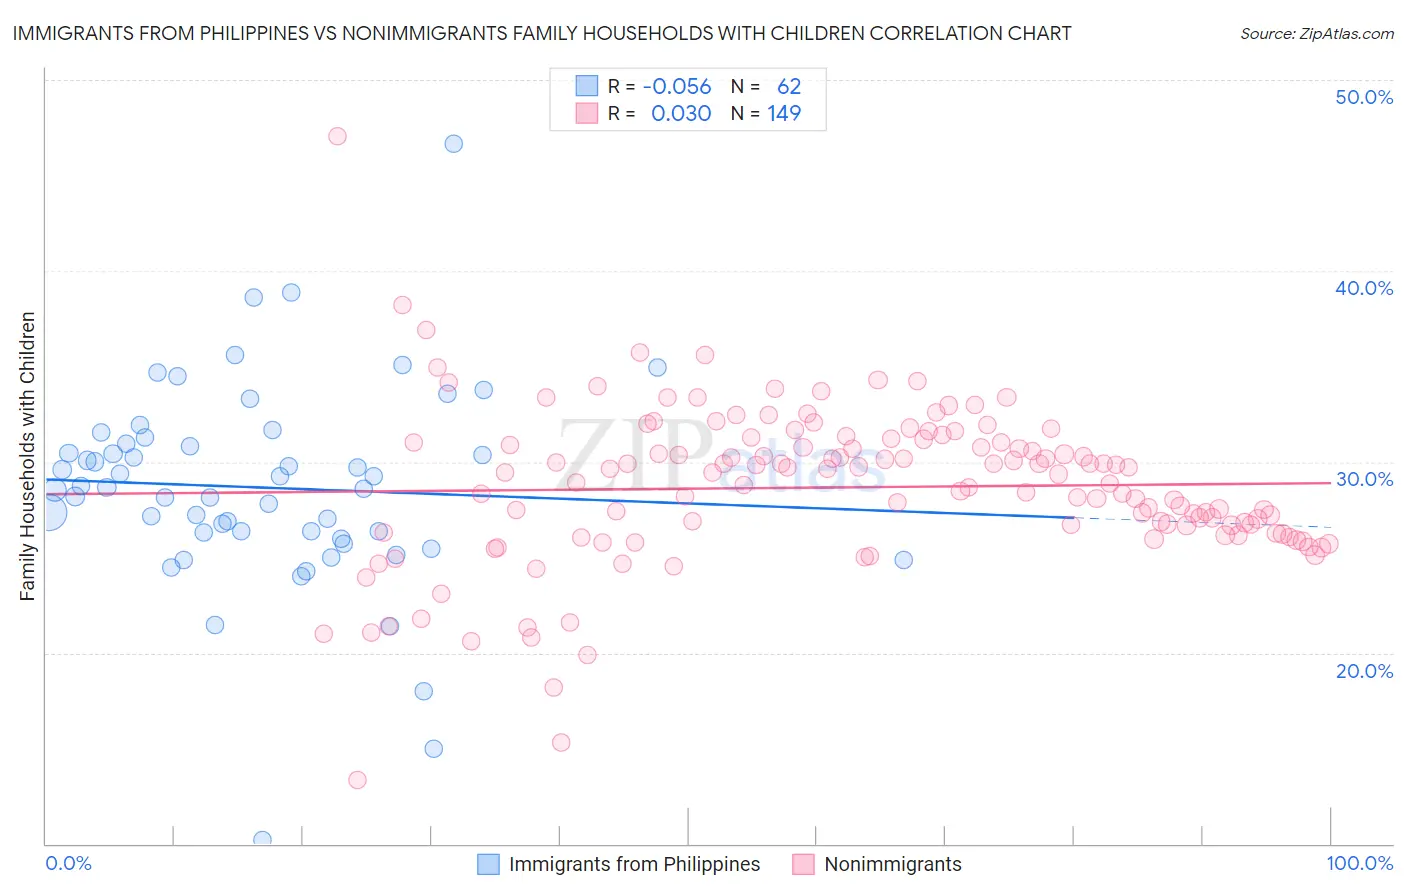
Immigrants from Philippines vs Nonimmigrants Family Households with Children Correlation Chart

The statistical analysis conducted on geographies consisting of 470,847,260 people shows a slight negative correlation between the proportion of Immigrants from Philippines and percentage of family households with children in the United States with a correlation coefficient (R) of -0.056 and weighted average of 29.0%. Similarly, the statistical analysis conducted on geographies consisting of 583,873,030 people shows no correlation between the proportion of Nonimmigrants and percentage of family households with children in the United States with a correlation coefficient (R) of 0.030 and weighted average of 27.5%, a difference of 5.4%.
Immigrants from Philippines vs Nonimmigrants Family Households with Children

Family Households with Children Correlation Summary

MeasurementImmigrants from PhilippinesNonimmigrants
Minimum10.2%13.3%
Maximum46.7%47.1%
Range36.5%33.7%
Mean28.7%28.7%
Median28.6%29.3%
Interquartile 25% (IQ1)26.3%26.2%
Interquartile 75% (IQ3)31.0%31.1%
Interquartile Range (IQR)4.7%4.9%
Standard Deviation (Sample)5.4%4.2%
Standard Deviation (Population)5.4%4.2%

Similar Demographics by Family Households with Children

Demographics Similar to Immigrants from Philippines by Family Households with Children

In terms of family households with children, the demographic groups most similar to Immigrants from Philippines are Peruvian (29.0%, a difference of 0.010%), Apache (29.0%, a difference of 0.040%), Fijian (29.0%, a difference of 0.090%), Jordanian (29.0%, a difference of 0.13%), and Immigrants from Taiwan (29.0%, a difference of 0.14%).
DemographicsRating | RankFamily Households with Children
Yaqui
100.0
/100
|
#39
Exceptional
29.1%
Central Americans
100.0
/100
|
#40
Exceptional
29.1%
Immigrants | South Eastern Asia
100.0
/100
|
#41
Exceptional
29.1%
Spanish American Indians
100.0
/100
|
#42
Exceptional
29.1%
Asians
100.0
/100
|
#43
Exceptional
29.1%
Immigrants | Taiwan
100.0
/100
|
#44
Exceptional
29.0%
Fijians
100.0
/100
|
#45
Exceptional
29.0%
Immigrants | Philippines
100.0
/100
|
#46
Exceptional
29.0%
Peruvians
100.0
/100
|
#47
Exceptional
29.0%
Apache
100.0
/100
|
#48
Exceptional
29.0%
Jordanians
100.0
/100
|
#49
Exceptional
29.0%
Immigrants | Immigrants
100.0
/100
|
#50
Exceptional
28.9%
Immigrants | Peru
100.0
/100
|
#51
Exceptional
28.9%
Guatemalans
100.0
/100
|
#52
Exceptional
28.9%
Immigrants | Cambodia
100.0
/100
|
#53
Exceptional
28.9%

Demographics Similar to Nonimmigrants by Family Households with Children

In terms of family households with children, the demographic groups most similar to Nonimmigrants are Immigrants from South Africa (27.5%, a difference of 0.0%), Dominican (27.5%, a difference of 0.0%), Immigrants from Kuwait (27.5%, a difference of 0.010%), Immigrants from Hong Kong (27.5%, a difference of 0.090%), and Czech (27.5%, a difference of 0.10%).
DemographicsRating | RankFamily Households with Children
Mongolians
70.7
/100
|
#159
Good
27.6%
Sub-Saharan Africans
67.5
/100
|
#160
Good
27.6%
Alaskan Athabascans
67.1
/100
|
#161
Good
27.6%
Immigrants | Bangladesh
67.0
/100
|
#162
Good
27.6%
Czechs
65.3
/100
|
#163
Good
27.5%
Immigrants | Hong Kong
64.9
/100
|
#164
Good
27.5%
Immigrants | South Africa
61.3
/100
|
#165
Good
27.5%
Immigrants | Nonimmigrants
61.2
/100
|
#166
Good
27.5%
Dominicans
61.1
/100
|
#167
Good
27.5%
Immigrants | Kuwait
60.9
/100
|
#168
Good
27.5%
Seminole
56.9
/100
|
#169
Average
27.5%
Cherokee
56.7
/100
|
#170
Average
27.5%
Blackfeet
54.3
/100
|
#171
Average
27.5%
Israelis
53.9
/100
|
#172
Average
27.5%
Immigrants | Argentina
52.2
/100
|
#173
Average
27.5%