Osage vs Immigrants from Switzerland Single Father Households
COMPARE
Osage
Immigrants from Switzerland
Single Father Households
Single Father Households Comparison
Osage
Immigrants from Switzerland
2.5%
SINGLE FATHER HOUSEHOLDS
4.1/ 100
METRIC RATING
242nd/ 347
METRIC RANK
2.0%
SINGLE FATHER HOUSEHOLDS
99.9/ 100
METRIC RATING
50th/ 347
METRIC RANK
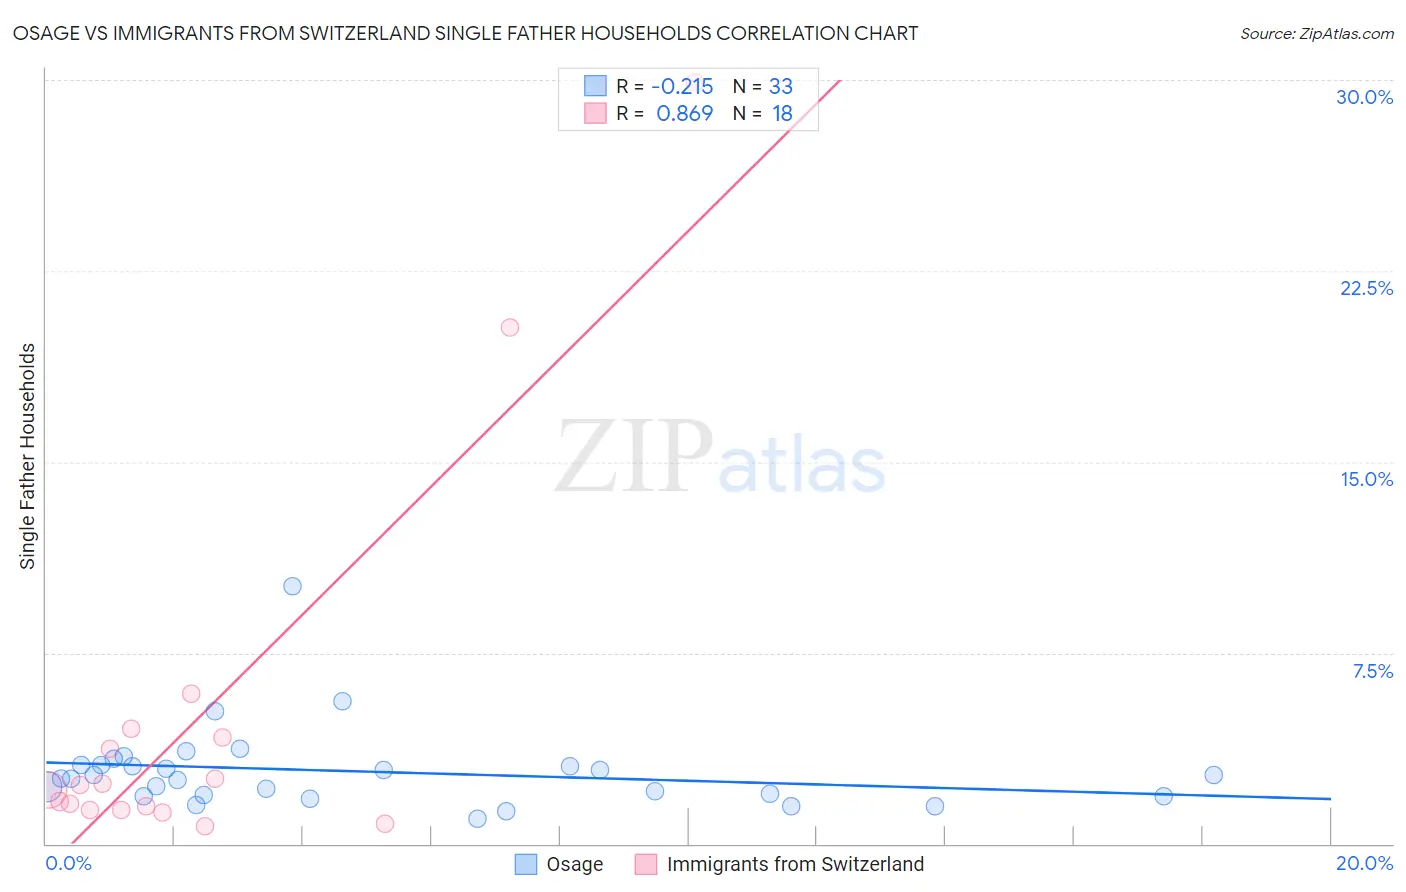
Osage vs Immigrants from Switzerland Single Father Households Correlation Chart
The statistical analysis conducted on geographies consisting of 91,601,275 people shows a weak negative correlation between the proportion of Osage and percentage of single father households in the United States with a correlation coefficient (R) of -0.215 and weighted average of 2.5%. Similarly, the statistical analysis conducted on geographies consisting of 147,445,509 people shows a very strong positive correlation between the proportion of Immigrants from Switzerland and percentage of single father households in the United States with a correlation coefficient (R) of 0.869 and weighted average of 2.0%, a difference of 22.7%.
Single Father Households Correlation Summary
| Measurement | Osage | Immigrants from Switzerland |
| Minimum | 0.98% | 0.69% |
| Maximum | 10.1% | 29.9% |
| Range | 9.2% | 29.2% |
| Mean | 2.8% | 4.9% |
| Median | 2.6% | 2.2% |
| Interquartile 25% (IQ1) | 1.9% | 1.3% |
| Interquartile 75% (IQ3) | 3.1% | 4.2% |
| Interquartile Range (IQR) | 1.2% | 2.8% |
| Standard Deviation (Sample) | 1.6% | 7.7% |
| Standard Deviation (Population) | 1.6% | 7.4% |
Similar Demographics by Single Father Households
Demographics Similar to Osage by Single Father Households
In terms of single father households, the demographic groups most similar to Osage are Portuguese (2.5%, a difference of 0.030%), Immigrants from Dominica (2.5%, a difference of 0.29%), Spaniard (2.5%, a difference of 0.46%), Immigrants from Oceania (2.5%, a difference of 0.65%), and Immigrants from Middle Africa (2.5%, a difference of 0.65%).
| Demographics | Rating | Rank | Single Father Households |
| Immigrants | Immigrants | 6.3 /100 | #235 | Tragic 2.5% |
| Cajuns | 6.1 /100 | #236 | Tragic 2.5% |
| Sierra Leoneans | 5.9 /100 | #237 | Tragic 2.5% |
| Immigrants | Sierra Leone | 5.8 /100 | #238 | Tragic 2.5% |
| Immigrants | Oceania | 5.8 /100 | #239 | Tragic 2.5% |
| Immigrants | Dominica | 4.8 /100 | #240 | Tragic 2.5% |
| Portuguese | 4.1 /100 | #241 | Tragic 2.5% |
| Osage | 4.1 /100 | #242 | Tragic 2.5% |
| Spaniards | 3.1 /100 | #243 | Tragic 2.5% |
| Immigrants | Middle Africa | 2.8 /100 | #244 | Tragic 2.5% |
| Basques | 2.5 /100 | #245 | Tragic 2.5% |
| Native Hawaiians | 2.5 /100 | #246 | Tragic 2.5% |
| Delaware | 2.5 /100 | #247 | Tragic 2.5% |
| Bahamians | 2.4 /100 | #248 | Tragic 2.5% |
| Immigrants | Cameroon | 2.3 /100 | #249 | Tragic 2.5% |
Demographics Similar to Immigrants from Switzerland by Single Father Households
In terms of single father households, the demographic groups most similar to Immigrants from Switzerland are Immigrants from Serbia (2.0%, a difference of 0.0%), Immigrants from Poland (2.0%, a difference of 0.0%), Immigrants from Kazakhstan (2.0%, a difference of 0.020%), Immigrants from Ukraine (2.0%, a difference of 0.040%), and Immigrants from Europe (2.0%, a difference of 0.24%).
| Demographics | Rating | Rank | Single Father Households |
| Immigrants | Grenada | 100.0 /100 | #43 | Exceptional 2.0% |
| Latvians | 100.0 /100 | #44 | Exceptional 2.0% |
| Russians | 100.0 /100 | #45 | Exceptional 2.0% |
| Immigrants | Lebanon | 100.0 /100 | #46 | Exceptional 2.0% |
| Immigrants | Ukraine | 99.9 /100 | #47 | Exceptional 2.0% |
| Immigrants | Kazakhstan | 99.9 /100 | #48 | Exceptional 2.0% |
| Immigrants | Serbia | 99.9 /100 | #49 | Exceptional 2.0% |
| Immigrants | Switzerland | 99.9 /100 | #50 | Exceptional 2.0% |
| Immigrants | Poland | 99.9 /100 | #51 | Exceptional 2.0% |
| Immigrants | Europe | 99.9 /100 | #52 | Exceptional 2.0% |
| Immigrants | Northern Europe | 99.9 /100 | #53 | Exceptional 2.0% |
| Immigrants | Korea | 99.9 /100 | #54 | Exceptional 2.0% |
| Immigrants | France | 99.9 /100 | #55 | Exceptional 2.0% |
| Immigrants | Norway | 99.9 /100 | #56 | Exceptional 2.0% |
| Burmese | 99.9 /100 | #57 | Exceptional 2.0% |