Syrian vs European Family Households with Children
COMPARE
Syrian
European
Family Households with Children
Family Households with Children Comparison
Syrians
Europeans
27.8%
FAMILY HOUSEHOLDS WITH CHILDREN
89.7/ 100
METRIC RATING
128th/ 347
METRIC RANK
27.9%
FAMILY HOUSEHOLDS WITH CHILDREN
95.4/ 100
METRIC RATING
120th/ 347
METRIC RANK
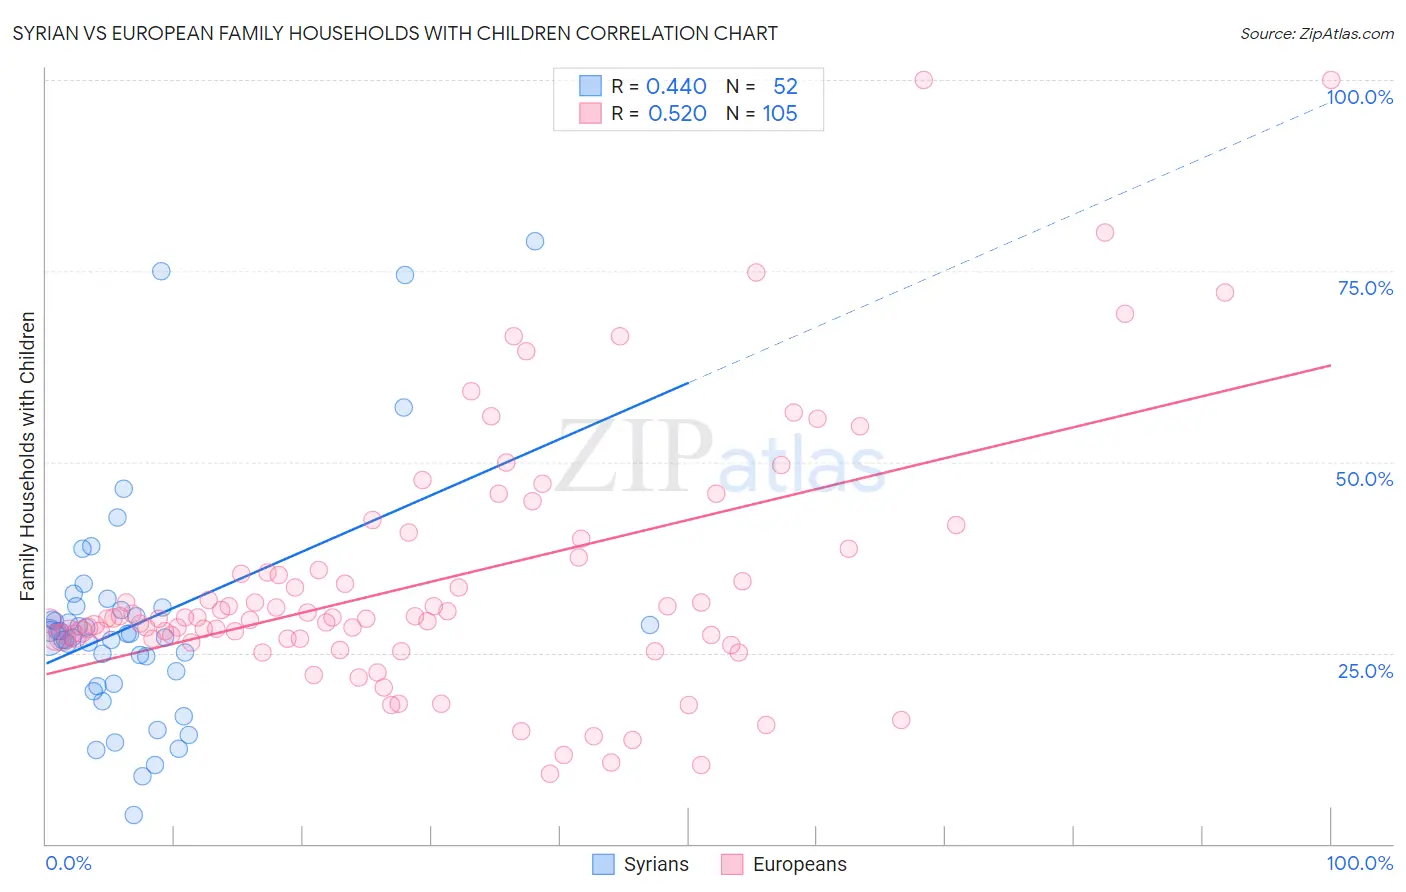
Syrian vs European Family Households with Children Correlation Chart
The statistical analysis conducted on geographies consisting of 266,095,178 people shows a moderate positive correlation between the proportion of Syrians and percentage of family households with children in the United States with a correlation coefficient (R) of 0.440 and weighted average of 27.8%. Similarly, the statistical analysis conducted on geographies consisting of 560,876,859 people shows a substantial positive correlation between the proportion of Europeans and percentage of family households with children in the United States with a correlation coefficient (R) of 0.520 and weighted average of 27.9%, a difference of 0.47%.
Family Households with Children Correlation Summary
| Measurement | Syrian | European |
| Minimum | 3.8% | 9.1% |
| Maximum | 78.9% | 100.0% |
| Range | 75.1% | 90.9% |
| Mean | 29.0% | 34.4% |
| Median | 27.2% | 29.6% |
| Interquartile 25% (IQ1) | 21.8% | 26.9% |
| Interquartile 75% (IQ3) | 30.8% | 38.0% |
| Interquartile Range (IQR) | 8.9% | 11.2% |
| Standard Deviation (Sample) | 15.0% | 16.9% |
| Standard Deviation (Population) | 14.8% | 16.8% |
Demographics Similar to Syrians and Europeans by Family Households with Children
In terms of family households with children, the demographic groups most similar to Syrians are Belizean (27.8%, a difference of 0.020%), Immigrants from Eritrea (27.8%, a difference of 0.020%), Immigrants from Ethiopia (27.8%, a difference of 0.050%), Immigrants from Singapore (27.8%, a difference of 0.070%), and Ecuadorian (27.8%, a difference of 0.070%). Similarly, the demographic groups most similar to Europeans are Zimbabwean (27.9%, a difference of 0.030%), Immigrants from Malaysia (27.9%, a difference of 0.070%), Central American Indian (27.9%, a difference of 0.070%), Pakistani (27.9%, a difference of 0.080%), and Immigrants from Western Asia (27.9%, a difference of 0.19%).
| Demographics | Rating | Rank | Family Households with Children |
| South American Indians | 96.9 /100 | #114 | Exceptional 28.0% |
| Immigrants | Africa | 96.8 /100 | #115 | Exceptional 28.0% |
| Pakistanis | 96.0 /100 | #116 | Exceptional 27.9% |
| Immigrants | Malaysia | 95.9 /100 | #117 | Exceptional 27.9% |
| Central American Indians | 95.9 /100 | #118 | Exceptional 27.9% |
| Zimbabweans | 95.6 /100 | #119 | Exceptional 27.9% |
| Europeans | 95.4 /100 | #120 | Exceptional 27.9% |
| Immigrants | Western Asia | 93.6 /100 | #121 | Exceptional 27.9% |
| Immigrants | Zimbabwe | 92.8 /100 | #122 | Exceptional 27.8% |
| Immigrants | Northern Africa | 91.8 /100 | #123 | Exceptional 27.8% |
| Immigrants | Singapore | 90.8 /100 | #124 | Exceptional 27.8% |
| Ecuadorians | 90.8 /100 | #125 | Exceptional 27.8% |
| Immigrants | Ethiopia | 90.5 /100 | #126 | Exceptional 27.8% |
| Belizeans | 90.0 /100 | #127 | Exceptional 27.8% |
| Syrians | 89.7 /100 | #128 | Excellent 27.8% |
| Immigrants | Eritrea | 89.4 /100 | #129 | Excellent 27.8% |
| Cajuns | 87.6 /100 | #130 | Excellent 27.7% |
| Lebanese | 87.4 /100 | #131 | Excellent 27.7% |
| Immigrants | Belize | 85.7 /100 | #132 | Excellent 27.7% |
| Iranians | 85.2 /100 | #133 | Excellent 27.7% |
| Immigrants | Panama | 84.9 /100 | #134 | Excellent 27.7% |