Thai vs Canadian Single Father Households
COMPARE
Thai
Canadian
Single Father Households
Single Father Households Comparison
Thais
Canadians
1.9%
SINGLE FATHER HOUSEHOLDS
100.0/ 100
METRIC RATING
20th/ 347
METRIC RANK
2.3%
SINGLE FATHER HOUSEHOLDS
79.7/ 100
METRIC RATING
157th/ 347
METRIC RANK
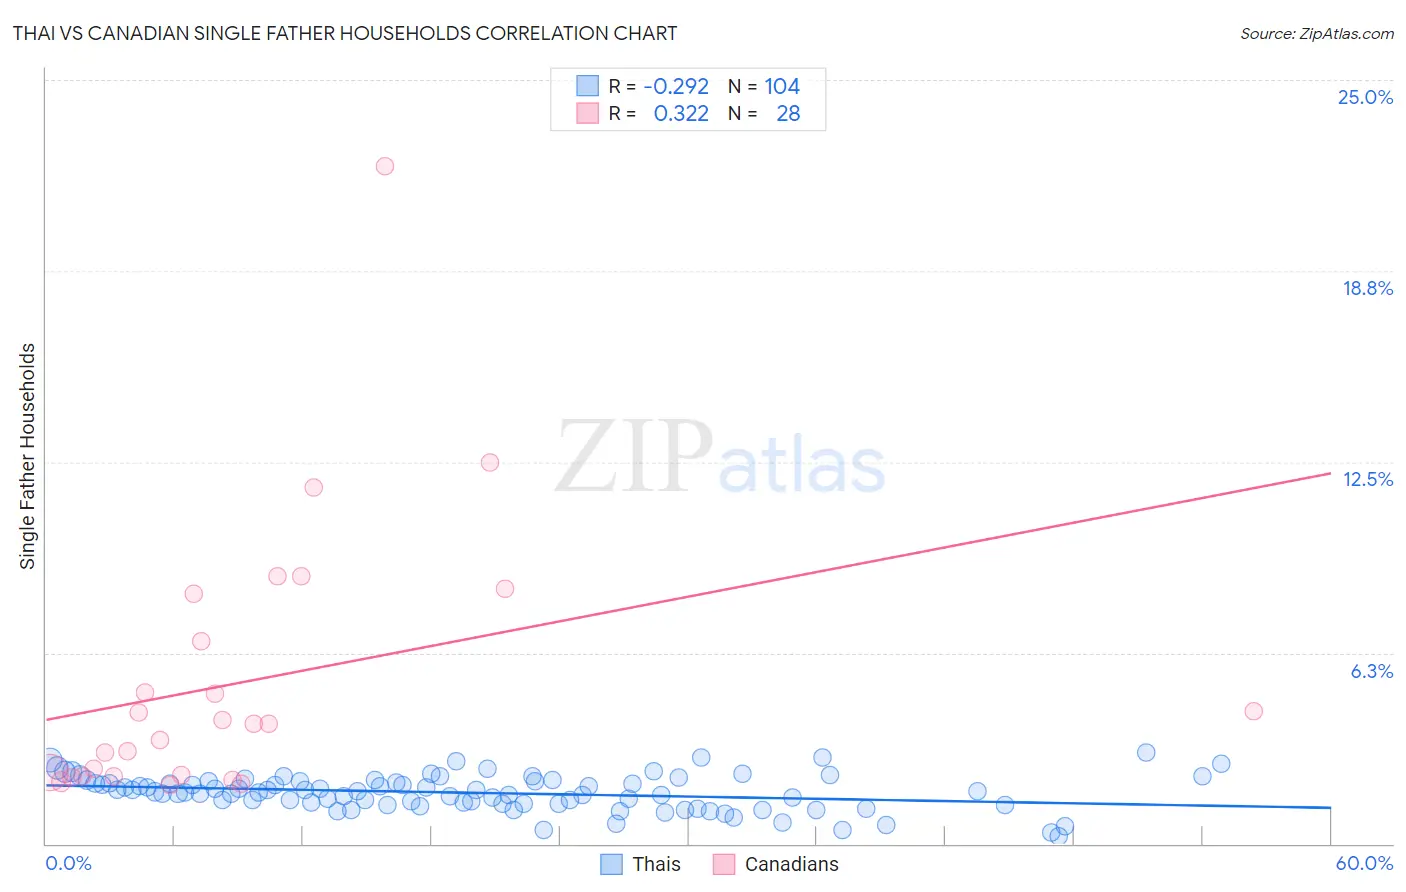
Thai vs Canadian Single Father Households Correlation Chart
The statistical analysis conducted on geographies consisting of 470,214,576 people shows a weak negative correlation between the proportion of Thais and percentage of single father households in the United States with a correlation coefficient (R) of -0.292 and weighted average of 1.9%. Similarly, the statistical analysis conducted on geographies consisting of 432,424,973 people shows a mild positive correlation between the proportion of Canadians and percentage of single father households in the United States with a correlation coefficient (R) of 0.322 and weighted average of 2.3%, a difference of 18.5%.
Single Father Households Correlation Summary
| Measurement | Thai | Canadian |
| Minimum | 0.26% | 1.9% |
| Maximum | 3.0% | 22.2% |
| Range | 2.7% | 20.3% |
| Mean | 1.7% | 5.3% |
| Median | 1.7% | 3.9% |
| Interquartile 25% (IQ1) | 1.3% | 2.2% |
| Interquartile 75% (IQ3) | 2.0% | 7.4% |
| Interquartile Range (IQR) | 0.72% | 5.2% |
| Standard Deviation (Sample) | 0.56% | 4.5% |
| Standard Deviation (Population) | 0.56% | 4.4% |
Similar Demographics by Single Father Households
Demographics Similar to Thais by Single Father Households
In terms of single father households, the demographic groups most similar to Thais are Iranian (1.9%, a difference of 0.070%), Immigrants from Albania (1.9%, a difference of 0.30%), Immigrants from Latvia (1.9%, a difference of 0.49%), Indian (Asian) (1.9%, a difference of 0.91%), and Immigrants from India (1.9%, a difference of 1.4%).
| Demographics | Rating | Rank | Single Father Households |
| Immigrants | Singapore | 100.0 /100 | #13 | Exceptional 1.9% |
| Immigrants | Lithuania | 100.0 /100 | #14 | Exceptional 1.9% |
| Immigrants | Eastern Asia | 100.0 /100 | #15 | Exceptional 1.9% |
| Immigrants | Iran | 100.0 /100 | #16 | Exceptional 1.9% |
| Immigrants | India | 100.0 /100 | #17 | Exceptional 1.9% |
| Indians (Asian) | 100.0 /100 | #18 | Exceptional 1.9% |
| Iranians | 100.0 /100 | #19 | Exceptional 1.9% |
| Thais | 100.0 /100 | #20 | Exceptional 1.9% |
| Immigrants | Albania | 100.0 /100 | #21 | Exceptional 1.9% |
| Immigrants | Latvia | 100.0 /100 | #22 | Exceptional 1.9% |
| Immigrants | Croatia | 100.0 /100 | #23 | Exceptional 2.0% |
| Immigrants | Russia | 100.0 /100 | #24 | Exceptional 2.0% |
| Eastern Europeans | 100.0 /100 | #25 | Exceptional 2.0% |
| Assyrians/Chaldeans/Syriacs | 100.0 /100 | #26 | Exceptional 2.0% |
| Immigrants | South Central Asia | 100.0 /100 | #27 | Exceptional 2.0% |
Demographics Similar to Canadians by Single Father Households
In terms of single father households, the demographic groups most similar to Canadians are Immigrants from South America (2.3%, a difference of 0.020%), Immigrants from Senegal (2.3%, a difference of 0.030%), European (2.3%, a difference of 0.14%), Bolivian (2.3%, a difference of 0.16%), and Immigrants from West Indies (2.3%, a difference of 0.20%).
| Demographics | Rating | Rank | Single Father Households |
| Venezuelans | 86.2 /100 | #150 | Excellent 2.3% |
| Immigrants | Syria | 84.8 /100 | #151 | Excellent 2.3% |
| Immigrants | Venezuela | 83.2 /100 | #152 | Excellent 2.3% |
| Immigrants | Germany | 82.8 /100 | #153 | Excellent 2.3% |
| Bolivians | 81.0 /100 | #154 | Excellent 2.3% |
| Europeans | 80.9 /100 | #155 | Excellent 2.3% |
| Immigrants | South America | 79.9 /100 | #156 | Good 2.3% |
| Canadians | 79.7 /100 | #157 | Good 2.3% |
| Immigrants | Senegal | 79.4 /100 | #158 | Good 2.3% |
| Immigrants | West Indies | 77.9 /100 | #159 | Good 2.3% |
| Immigrants | Bolivia | 76.3 /100 | #160 | Good 2.3% |
| Swiss | 73.2 /100 | #161 | Good 2.3% |
| Scottish | 72.8 /100 | #162 | Good 2.3% |
| Irish | 72.1 /100 | #163 | Good 2.3% |
| Pakistanis | 70.6 /100 | #164 | Good 2.3% |