Chilean vs Pima Single Mother Households
COMPARE
Chilean
Pima
Single Mother Households
Single Mother Households Comparison
Chileans
Pima
6.1%
SINGLE MOTHER HOUSEHOLDS
74.2/ 100
METRIC RATING
157th/ 347
METRIC RANK
8.3%
SINGLE MOTHER HOUSEHOLDS
0.0/ 100
METRIC RATING
322nd/ 347
METRIC RANK
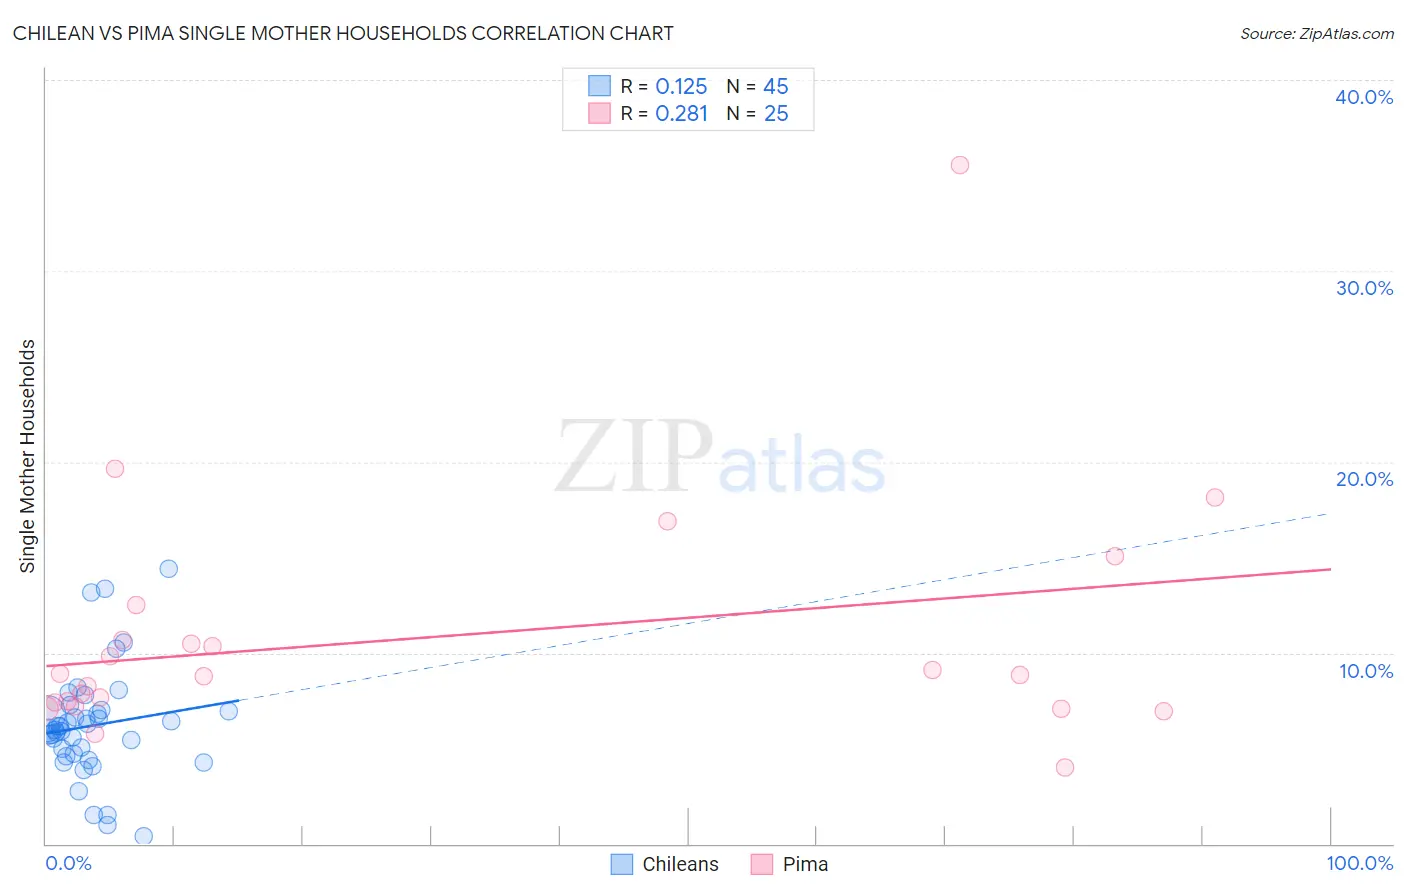
Chilean vs Pima Single Mother Households Correlation Chart
The statistical analysis conducted on geographies consisting of 256,326,378 people shows a poor positive correlation between the proportion of Chileans and percentage of single mother households in the United States with a correlation coefficient (R) of 0.125 and weighted average of 6.1%. Similarly, the statistical analysis conducted on geographies consisting of 61,448,407 people shows a weak positive correlation between the proportion of Pima and percentage of single mother households in the United States with a correlation coefficient (R) of 0.281 and weighted average of 8.3%, a difference of 35.1%.
Single Mother Households Correlation Summary
| Measurement | Chilean | Pima |
| Minimum | 0.42% | 4.0% |
| Maximum | 14.4% | 35.5% |
| Range | 14.0% | 31.6% |
| Mean | 6.2% | 10.9% |
| Median | 6.0% | 8.8% |
| Interquartile 25% (IQ1) | 4.6% | 7.3% |
| Interquartile 75% (IQ3) | 7.0% | 11.6% |
| Interquartile Range (IQR) | 2.3% | 4.3% |
| Standard Deviation (Sample) | 2.9% | 6.4% |
| Standard Deviation (Population) | 2.9% | 6.3% |
Similar Demographics by Single Mother Households
Demographics Similar to Chileans by Single Mother Households
In terms of single mother households, the demographic groups most similar to Chileans are Native Hawaiian (6.1%, a difference of 0.11%), Celtic (6.1%, a difference of 0.13%), Yugoslavian (6.1%, a difference of 0.17%), Iraqi (6.1%, a difference of 0.19%), and Immigrants from Germany (6.1%, a difference of 0.27%).
| Demographics | Rating | Rank | Single Mother Households |
| Zimbabweans | 80.7 /100 | #150 | Excellent 6.1% |
| Immigrants | Southern Europe | 80.5 /100 | #151 | Excellent 6.1% |
| Pakistanis | 79.2 /100 | #152 | Good 6.1% |
| Immigrants | Brazil | 78.9 /100 | #153 | Good 6.1% |
| Immigrants | Philippines | 78.5 /100 | #154 | Good 6.1% |
| Whites/Caucasians | 76.5 /100 | #155 | Good 6.1% |
| Native Hawaiians | 75.0 /100 | #156 | Good 6.1% |
| Chileans | 74.2 /100 | #157 | Good 6.1% |
| Celtics | 73.3 /100 | #158 | Good 6.1% |
| Yugoslavians | 73.1 /100 | #159 | Good 6.1% |
| Iraqis | 73.0 /100 | #160 | Good 6.1% |
| Immigrants | Germany | 72.4 /100 | #161 | Good 6.1% |
| Immigrants | Zimbabwe | 69.9 /100 | #162 | Good 6.2% |
| Alsatians | 68.7 /100 | #163 | Good 6.2% |
| Immigrants | Northern Africa | 68.0 /100 | #164 | Good 6.2% |
Demographics Similar to Pima by Single Mother Households
In terms of single mother households, the demographic groups most similar to Pima are Immigrants from Senegal (8.3%, a difference of 0.080%), Bahamian (8.3%, a difference of 0.32%), Jamaican (8.2%, a difference of 0.44%), Haitian (8.3%, a difference of 0.53%), and Senegalese (8.2%, a difference of 0.55%).
| Demographics | Rating | Rank | Single Mother Households |
| Immigrants | Western Africa | 0.0 /100 | #315 | Tragic 8.2% |
| Africans | 0.0 /100 | #316 | Tragic 8.2% |
| Immigrants | Honduras | 0.0 /100 | #317 | Tragic 8.2% |
| Senegalese | 0.0 /100 | #318 | Tragic 8.2% |
| Jamaicans | 0.0 /100 | #319 | Tragic 8.2% |
| Bahamians | 0.0 /100 | #320 | Tragic 8.3% |
| Immigrants | Senegal | 0.0 /100 | #321 | Tragic 8.3% |
| Pima | 0.0 /100 | #322 | Tragic 8.3% |
| Haitians | 0.0 /100 | #323 | Tragic 8.3% |
| Immigrants | Jamaica | 0.0 /100 | #324 | Tragic 8.4% |
| Immigrants | Caribbean | 0.0 /100 | #325 | Tragic 8.4% |
| British West Indians | 0.0 /100 | #326 | Tragic 8.4% |
| Immigrants | Haiti | 0.0 /100 | #327 | Tragic 8.4% |
| Yakama | 0.0 /100 | #328 | Tragic 8.4% |
| Hopi | 0.0 /100 | #329 | Tragic 8.5% |