Immigrants from Bolivia vs Pima Single Mother Households
COMPARE
Immigrants from Bolivia
Pima
Single Mother Households
Single Mother Households Comparison
Immigrants from Bolivia
Pima
5.9%
SINGLE MOTHER HOUSEHOLDS
92.2/ 100
METRIC RATING
129th/ 347
METRIC RANK
8.3%
SINGLE MOTHER HOUSEHOLDS
0.0/ 100
METRIC RATING
322nd/ 347
METRIC RANK
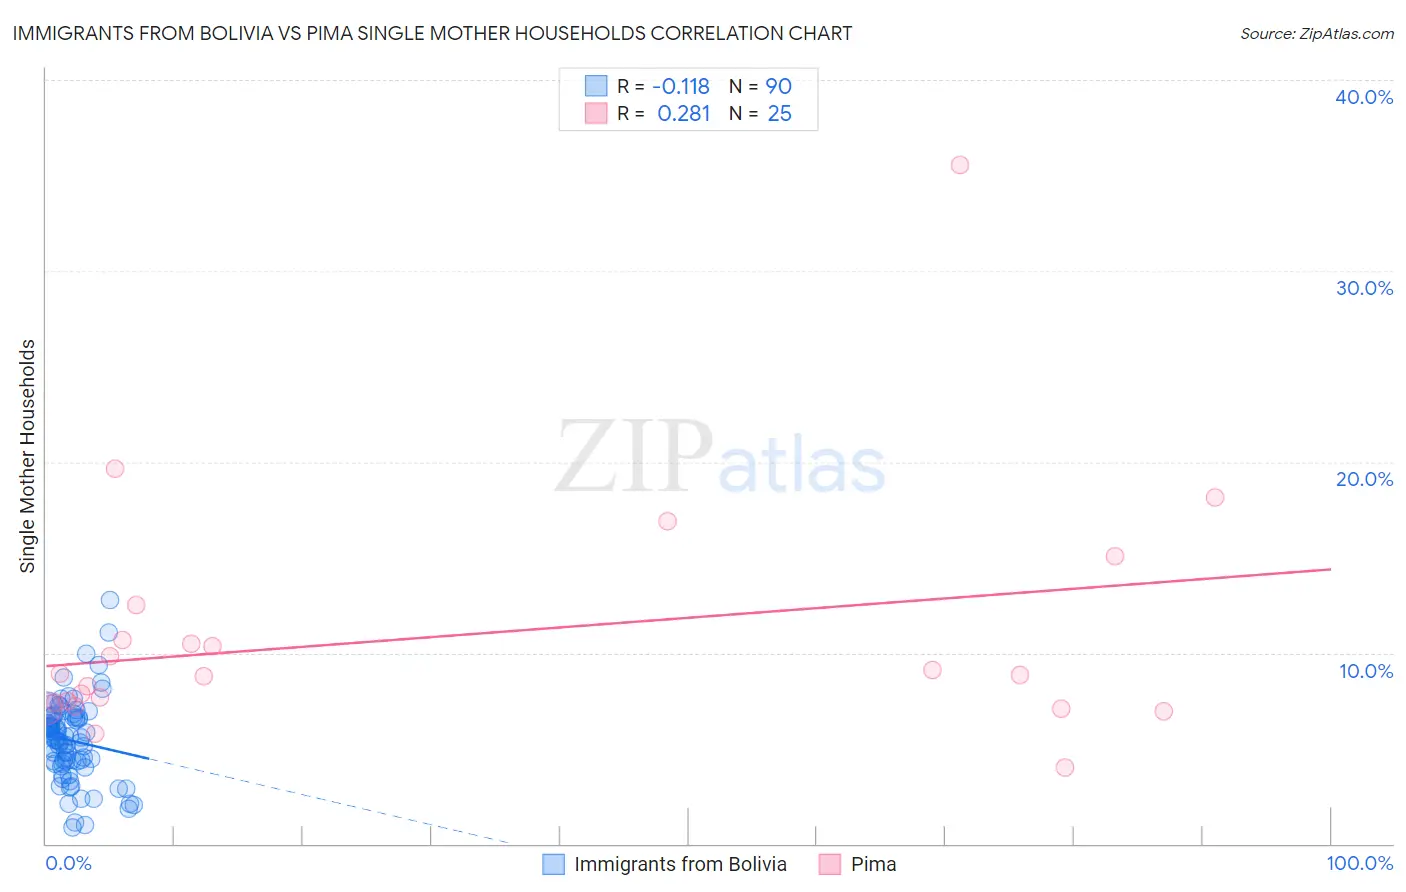
Immigrants from Bolivia vs Pima Single Mother Households Correlation Chart
The statistical analysis conducted on geographies consisting of 158,622,622 people shows a poor negative correlation between the proportion of Immigrants from Bolivia and percentage of single mother households in the United States with a correlation coefficient (R) of -0.118 and weighted average of 5.9%. Similarly, the statistical analysis conducted on geographies consisting of 61,448,407 people shows a weak positive correlation between the proportion of Pima and percentage of single mother households in the United States with a correlation coefficient (R) of 0.281 and weighted average of 8.3%, a difference of 40.7%.
Single Mother Households Correlation Summary
| Measurement | Immigrants from Bolivia | Pima |
| Minimum | 0.85% | 4.0% |
| Maximum | 12.8% | 35.5% |
| Range | 11.9% | 31.6% |
| Mean | 5.4% | 10.9% |
| Median | 5.6% | 8.8% |
| Interquartile 25% (IQ1) | 4.3% | 7.3% |
| Interquartile 75% (IQ3) | 6.6% | 11.6% |
| Interquartile Range (IQR) | 2.3% | 4.3% |
| Standard Deviation (Sample) | 2.1% | 6.4% |
| Standard Deviation (Population) | 2.1% | 6.3% |
Similar Demographics by Single Mother Households
Demographics Similar to Immigrants from Bolivia by Single Mother Households
In terms of single mother households, the demographic groups most similar to Immigrants from Bolivia are Czechoslovakian (5.9%, a difference of 0.010%), Palestinian (5.9%, a difference of 0.030%), Lebanese (5.9%, a difference of 0.090%), Welsh (5.9%, a difference of 0.28%), and Slavic (5.9%, a difference of 0.30%).
| Demographics | Rating | Rank | Single Mother Households |
| Belgians | 93.5 /100 | #122 | Exceptional 5.8% |
| Immigrants | Uzbekistan | 93.4 /100 | #123 | Exceptional 5.9% |
| Immigrants | Argentina | 93.2 /100 | #124 | Exceptional 5.9% |
| Slavs | 92.9 /100 | #125 | Exceptional 5.9% |
| Welsh | 92.8 /100 | #126 | Exceptional 5.9% |
| Lebanese | 92.4 /100 | #127 | Exceptional 5.9% |
| Czechoslovakians | 92.2 /100 | #128 | Exceptional 5.9% |
| Immigrants | Bolivia | 92.2 /100 | #129 | Exceptional 5.9% |
| Palestinians | 92.1 /100 | #130 | Exceptional 5.9% |
| Immigrants | Spain | 91.2 /100 | #131 | Exceptional 5.9% |
| Albanians | 91.1 /100 | #132 | Exceptional 5.9% |
| Egyptians | 90.7 /100 | #133 | Exceptional 5.9% |
| Canadians | 90.5 /100 | #134 | Exceptional 5.9% |
| Immigrants | Saudi Arabia | 90.2 /100 | #135 | Exceptional 5.9% |
| Jordanians | 88.9 /100 | #136 | Excellent 6.0% |
Demographics Similar to Pima by Single Mother Households
In terms of single mother households, the demographic groups most similar to Pima are Immigrants from Senegal (8.3%, a difference of 0.080%), Bahamian (8.3%, a difference of 0.32%), Jamaican (8.2%, a difference of 0.44%), Haitian (8.3%, a difference of 0.53%), and Senegalese (8.2%, a difference of 0.55%).
| Demographics | Rating | Rank | Single Mother Households |
| Immigrants | Western Africa | 0.0 /100 | #315 | Tragic 8.2% |
| Africans | 0.0 /100 | #316 | Tragic 8.2% |
| Immigrants | Honduras | 0.0 /100 | #317 | Tragic 8.2% |
| Senegalese | 0.0 /100 | #318 | Tragic 8.2% |
| Jamaicans | 0.0 /100 | #319 | Tragic 8.2% |
| Bahamians | 0.0 /100 | #320 | Tragic 8.3% |
| Immigrants | Senegal | 0.0 /100 | #321 | Tragic 8.3% |
| Pima | 0.0 /100 | #322 | Tragic 8.3% |
| Haitians | 0.0 /100 | #323 | Tragic 8.3% |
| Immigrants | Jamaica | 0.0 /100 | #324 | Tragic 8.4% |
| Immigrants | Caribbean | 0.0 /100 | #325 | Tragic 8.4% |
| British West Indians | 0.0 /100 | #326 | Tragic 8.4% |
| Immigrants | Haiti | 0.0 /100 | #327 | Tragic 8.4% |
| Yakama | 0.0 /100 | #328 | Tragic 8.4% |
| Hopi | 0.0 /100 | #329 | Tragic 8.5% |