Immigrants from Zaire vs Pima Single Mother Households
COMPARE
Immigrants from Zaire
Pima
Single Mother Households
Single Mother Households Comparison
Immigrants from Zaire
Pima
7.4%
SINGLE MOTHER HOUSEHOLDS
0.2/ 100
METRIC RATING
260th/ 347
METRIC RANK
8.3%
SINGLE MOTHER HOUSEHOLDS
0.0/ 100
METRIC RATING
322nd/ 347
METRIC RANK
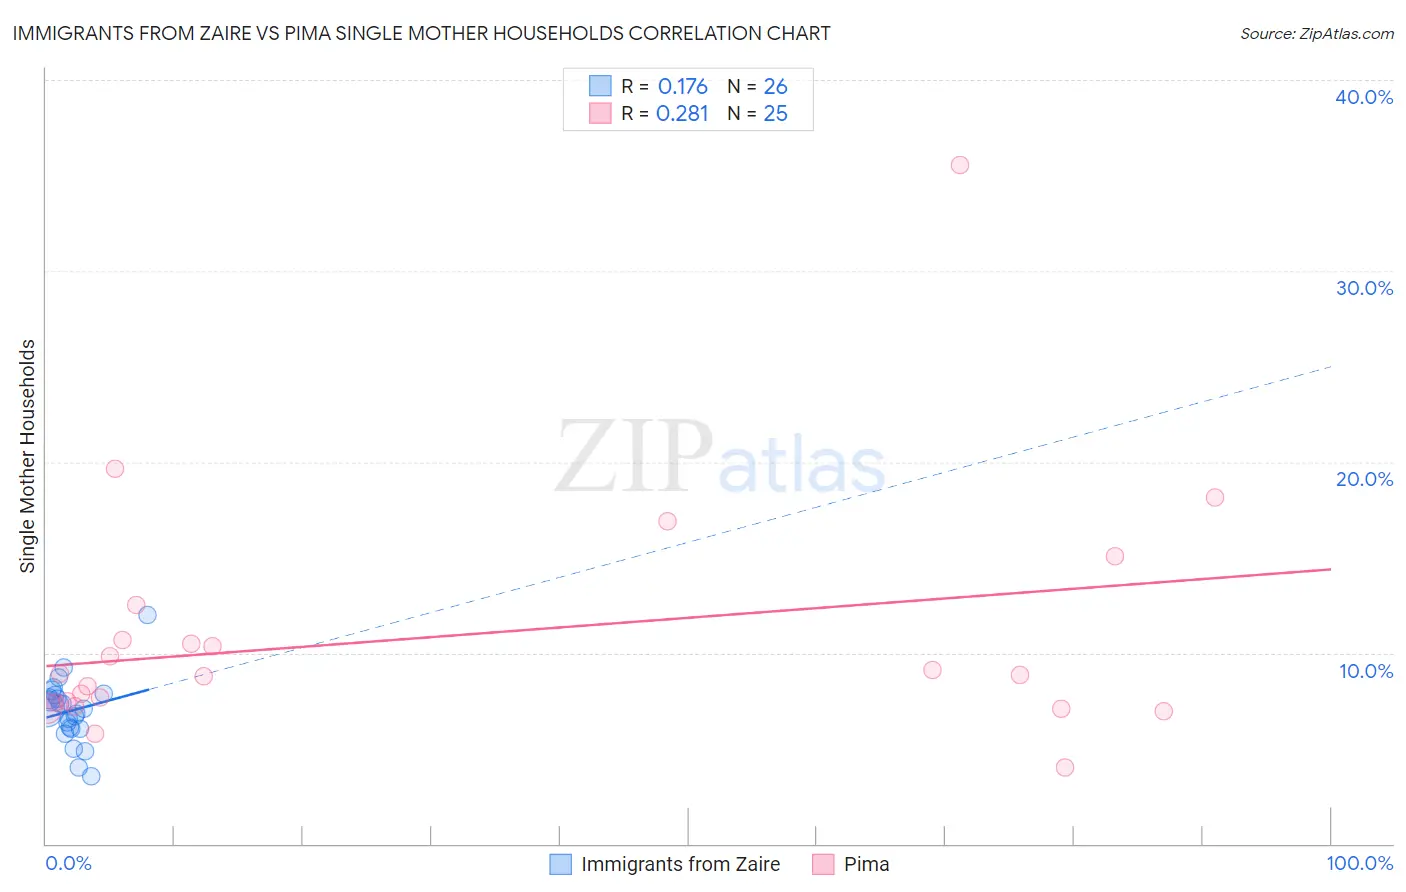
Immigrants from Zaire vs Pima Single Mother Households Correlation Chart
The statistical analysis conducted on geographies consisting of 107,226,907 people shows a poor positive correlation between the proportion of Immigrants from Zaire and percentage of single mother households in the United States with a correlation coefficient (R) of 0.176 and weighted average of 7.4%. Similarly, the statistical analysis conducted on geographies consisting of 61,448,407 people shows a weak positive correlation between the proportion of Pima and percentage of single mother households in the United States with a correlation coefficient (R) of 0.281 and weighted average of 8.3%, a difference of 11.8%.
Single Mother Households Correlation Summary
| Measurement | Immigrants from Zaire | Pima |
| Minimum | 3.5% | 4.0% |
| Maximum | 12.0% | 35.5% |
| Range | 8.5% | 31.6% |
| Mean | 7.0% | 10.9% |
| Median | 7.1% | 8.8% |
| Interquartile 25% (IQ1) | 6.1% | 7.3% |
| Interquartile 75% (IQ3) | 7.8% | 11.6% |
| Interquartile Range (IQR) | 1.7% | 4.3% |
| Standard Deviation (Sample) | 1.7% | 6.4% |
| Standard Deviation (Population) | 1.7% | 6.3% |
Similar Demographics by Single Mother Households
Demographics Similar to Immigrants from Zaire by Single Mother Households
In terms of single mother households, the demographic groups most similar to Immigrants from Zaire are Japanese (7.4%, a difference of 0.020%), Immigrants from Yemen (7.4%, a difference of 0.040%), Pueblo (7.4%, a difference of 0.060%), Alaska Native (7.4%, a difference of 0.080%), and Seminole (7.4%, a difference of 0.13%).
| Demographics | Rating | Rank | Single Mother Households |
| Cajuns | 0.3 /100 | #253 | Tragic 7.3% |
| Immigrants | Ecuador | 0.3 /100 | #254 | Tragic 7.3% |
| Mexican American Indians | 0.2 /100 | #255 | Tragic 7.4% |
| Seminole | 0.2 /100 | #256 | Tragic 7.4% |
| Alaska Natives | 0.2 /100 | #257 | Tragic 7.4% |
| Pueblo | 0.2 /100 | #258 | Tragic 7.4% |
| Immigrants | Yemen | 0.2 /100 | #259 | Tragic 7.4% |
| Immigrants | Zaire | 0.2 /100 | #260 | Tragic 7.4% |
| Japanese | 0.2 /100 | #261 | Tragic 7.4% |
| Immigrants | Somalia | 0.2 /100 | #262 | Tragic 7.4% |
| Immigrants | Nicaragua | 0.2 /100 | #263 | Tragic 7.4% |
| Yaqui | 0.1 /100 | #264 | Tragic 7.4% |
| Crow | 0.1 /100 | #265 | Tragic 7.4% |
| Nepalese | 0.1 /100 | #266 | Tragic 7.5% |
| Blackfeet | 0.1 /100 | #267 | Tragic 7.5% |
Demographics Similar to Pima by Single Mother Households
In terms of single mother households, the demographic groups most similar to Pima are Immigrants from Senegal (8.3%, a difference of 0.080%), Bahamian (8.3%, a difference of 0.32%), Jamaican (8.2%, a difference of 0.44%), Haitian (8.3%, a difference of 0.53%), and Senegalese (8.2%, a difference of 0.55%).
| Demographics | Rating | Rank | Single Mother Households |
| Immigrants | Western Africa | 0.0 /100 | #315 | Tragic 8.2% |
| Africans | 0.0 /100 | #316 | Tragic 8.2% |
| Immigrants | Honduras | 0.0 /100 | #317 | Tragic 8.2% |
| Senegalese | 0.0 /100 | #318 | Tragic 8.2% |
| Jamaicans | 0.0 /100 | #319 | Tragic 8.2% |
| Bahamians | 0.0 /100 | #320 | Tragic 8.3% |
| Immigrants | Senegal | 0.0 /100 | #321 | Tragic 8.3% |
| Pima | 0.0 /100 | #322 | Tragic 8.3% |
| Haitians | 0.0 /100 | #323 | Tragic 8.3% |
| Immigrants | Jamaica | 0.0 /100 | #324 | Tragic 8.4% |
| Immigrants | Caribbean | 0.0 /100 | #325 | Tragic 8.4% |
| British West Indians | 0.0 /100 | #326 | Tragic 8.4% |
| Immigrants | Haiti | 0.0 /100 | #327 | Tragic 8.4% |
| Yakama | 0.0 /100 | #328 | Tragic 8.4% |
| Hopi | 0.0 /100 | #329 | Tragic 8.5% |