Taiwanese vs Northern European Family Households
COMPARE
Taiwanese
Northern European
Family Households
Family Households Comparison
Taiwanese
Northern Europeans
63.3%
FAMILY HOUSEHOLDS
1.2/ 100
METRIC RATING
251st/ 347
METRIC RANK
64.1%
FAMILY HOUSEHOLDS
28.2/ 100
METRIC RATING
187th/ 347
METRIC RANK
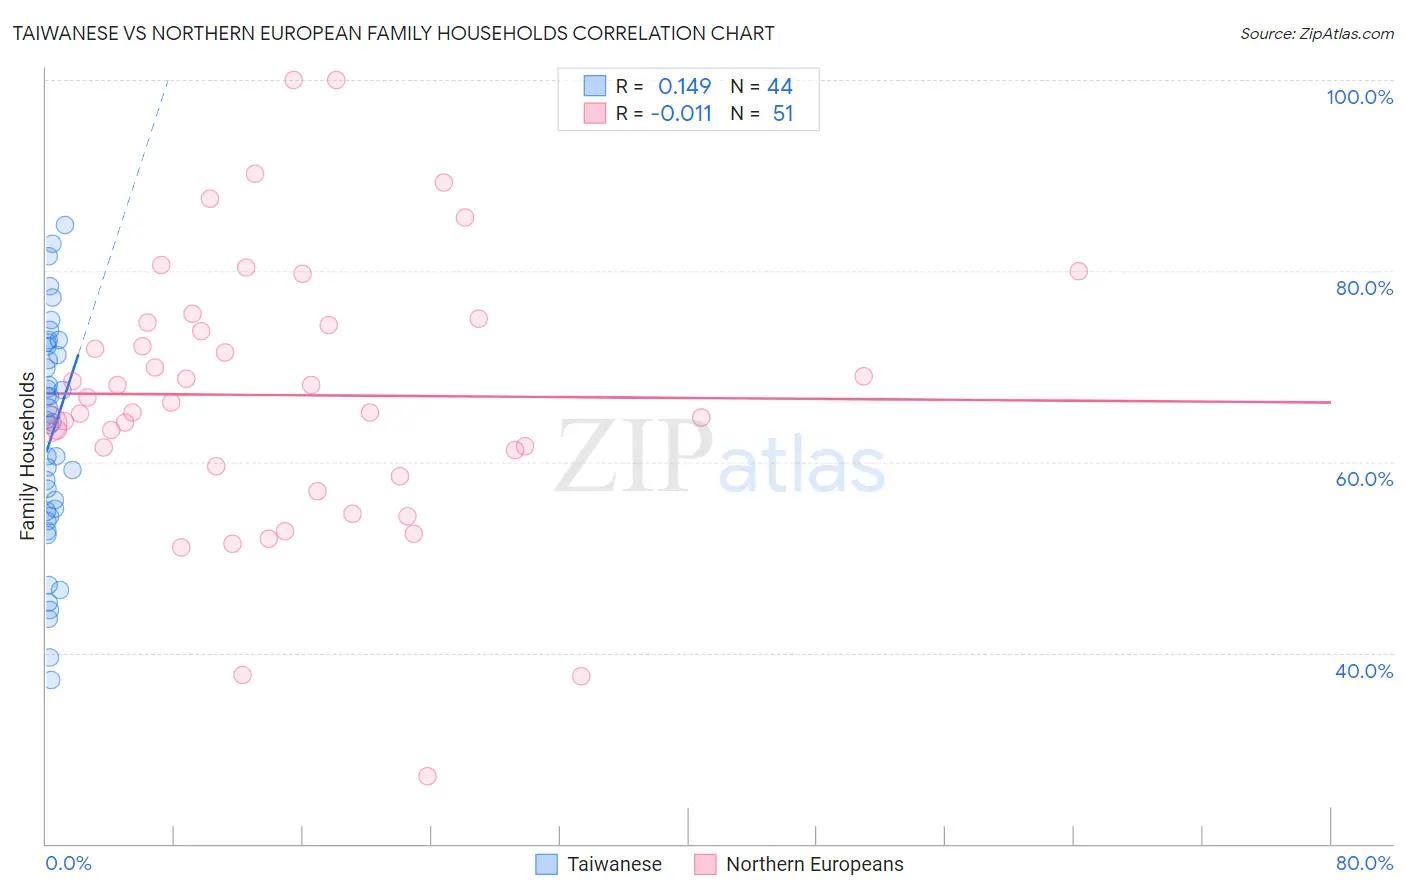
Taiwanese vs Northern European Family Households Correlation Chart
The statistical analysis conducted on geographies consisting of 31,715,954 people shows a poor positive correlation between the proportion of Taiwanese and percentage of family households in the United States with a correlation coefficient (R) of 0.149 and weighted average of 63.3%. Similarly, the statistical analysis conducted on geographies consisting of 405,947,196 people shows no correlation between the proportion of Northern Europeans and percentage of family households in the United States with a correlation coefficient (R) of -0.011 and weighted average of 64.1%, a difference of 1.2%.
Family Households Correlation Summary
| Measurement | Taiwanese | Northern European |
| Minimum | 37.1% | 27.1% |
| Maximum | 84.9% | 100.0% |
| Range | 47.7% | 72.9% |
| Mean | 62.6% | 67.0% |
| Median | 64.3% | 66.2% |
| Interquartile 25% (IQ1) | 54.6% | 59.5% |
| Interquartile 75% (IQ3) | 71.6% | 74.7% |
| Interquartile Range (IQR) | 17.0% | 15.1% |
| Standard Deviation (Sample) | 11.8% | 14.3% |
| Standard Deviation (Population) | 11.7% | 14.2% |
Similar Demographics by Family Households
Demographics Similar to Taiwanese by Family Households
In terms of family households, the demographic groups most similar to Taiwanese are Bahamian (63.3%, a difference of 0.010%), Immigrants from Dominican Republic (63.3%, a difference of 0.040%), Slovak (63.3%, a difference of 0.040%), Immigrants from Japan (63.4%, a difference of 0.050%), and Russian (63.4%, a difference of 0.070%).
| Demographics | Rating | Rank | Family Households |
| Eastern Europeans | 1.6 /100 | #244 | Tragic 63.4% |
| Immigrants | Dominica | 1.6 /100 | #245 | Tragic 63.4% |
| Immigrants | Ghana | 1.6 /100 | #246 | Tragic 63.4% |
| Immigrants | Uzbekistan | 1.5 /100 | #247 | Tragic 63.4% |
| Dominicans | 1.5 /100 | #248 | Tragic 63.4% |
| Russians | 1.4 /100 | #249 | Tragic 63.4% |
| Immigrants | Japan | 1.4 /100 | #250 | Tragic 63.4% |
| Taiwanese | 1.2 /100 | #251 | Tragic 63.3% |
| Bahamians | 1.1 /100 | #252 | Tragic 63.3% |
| Immigrants | Dominican Republic | 1.0 /100 | #253 | Tragic 63.3% |
| Slovaks | 1.0 /100 | #254 | Tragic 63.3% |
| Potawatomi | 1.0 /100 | #255 | Tragic 63.3% |
| Luxembourgers | 0.9 /100 | #256 | Tragic 63.3% |
| Icelanders | 0.8 /100 | #257 | Tragic 63.3% |
| Immigrants | Barbados | 0.7 /100 | #258 | Tragic 63.2% |
Demographics Similar to Northern Europeans by Family Households
In terms of family households, the demographic groups most similar to Northern Europeans are Spanish American (64.1%, a difference of 0.030%), Paraguayan (64.1%, a difference of 0.030%), Immigrants from Iran (64.1%, a difference of 0.040%), Immigrants from Western Asia (64.1%, a difference of 0.050%), and Zimbabwean (64.1%, a difference of 0.060%).
| Demographics | Rating | Rank | Family Households |
| Immigrants | Honduras | 35.0 /100 | #180 | Fair 64.2% |
| Immigrants | Trinidad and Tobago | 34.9 /100 | #181 | Fair 64.2% |
| Ukrainians | 34.6 /100 | #182 | Fair 64.2% |
| Creek | 34.1 /100 | #183 | Fair 64.2% |
| Puerto Ricans | 33.4 /100 | #184 | Fair 64.2% |
| Immigrants | Iran | 30.4 /100 | #185 | Fair 64.1% |
| Spanish Americans | 30.1 /100 | #186 | Fair 64.1% |
| Northern Europeans | 28.2 /100 | #187 | Fair 64.1% |
| Paraguayans | 26.7 /100 | #188 | Fair 64.1% |
| Immigrants | Western Asia | 25.3 /100 | #189 | Fair 64.1% |
| Zimbabweans | 24.7 /100 | #190 | Fair 64.1% |
| Arabs | 24.5 /100 | #191 | Fair 64.1% |
| Lithuanians | 23.8 /100 | #192 | Fair 64.0% |
| French | 23.7 /100 | #193 | Fair 64.0% |
| Paiute | 22.2 /100 | #194 | Fair 64.0% |