Taiwanese vs Nicaraguan Family Households
COMPARE
Taiwanese
Nicaraguan
Family Households
Family Households Comparison
Taiwanese
Nicaraguans
63.3%
FAMILY HOUSEHOLDS
1.2/ 100
METRIC RATING
251st/ 347
METRIC RANK
67.4%
FAMILY HOUSEHOLDS
100.0/ 100
METRIC RATING
29th/ 347
METRIC RANK
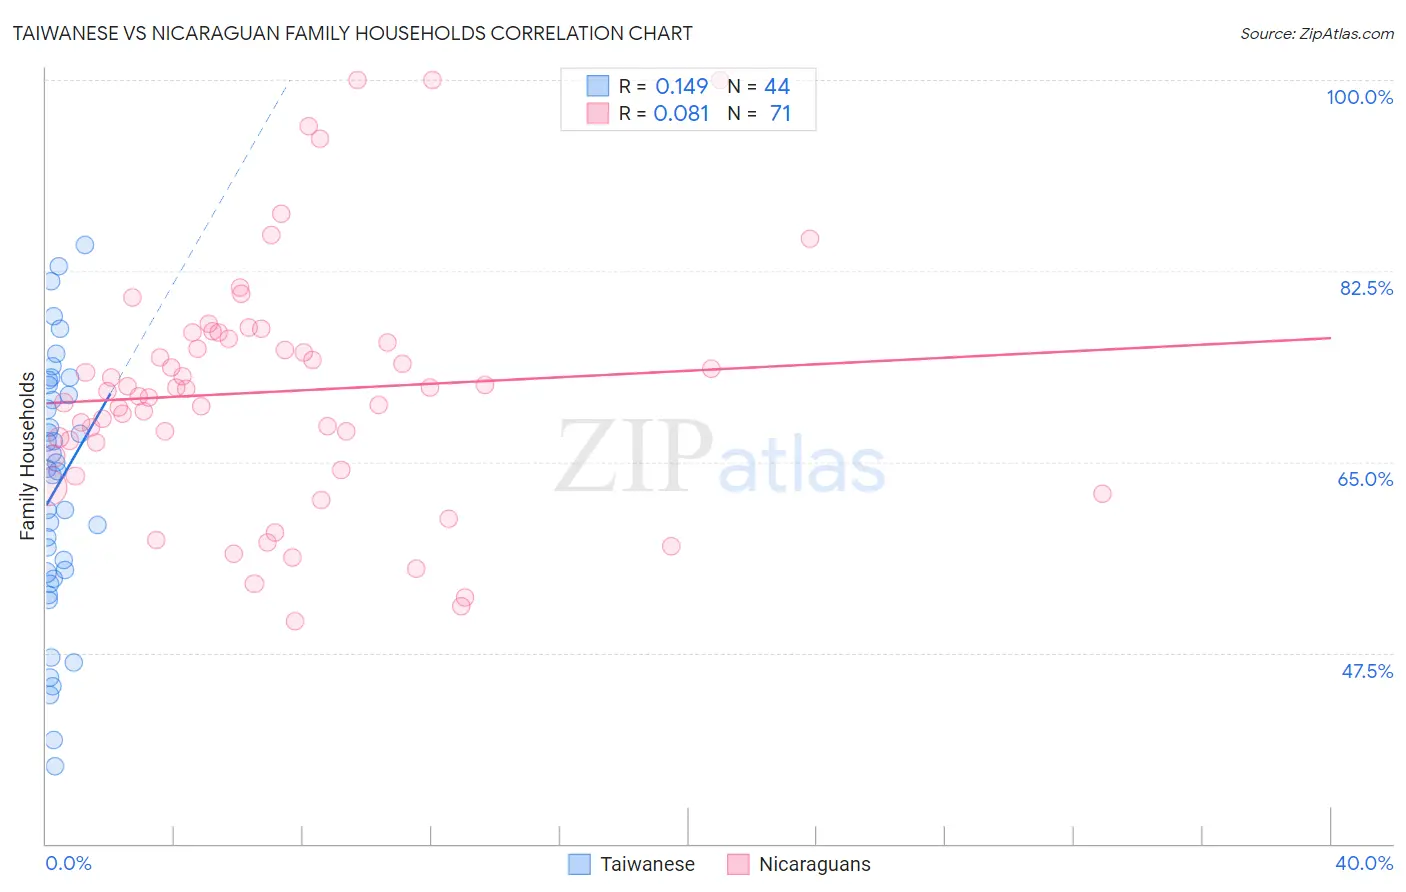
Taiwanese vs Nicaraguan Family Households Correlation Chart
The statistical analysis conducted on geographies consisting of 31,715,954 people shows a poor positive correlation between the proportion of Taiwanese and percentage of family households in the United States with a correlation coefficient (R) of 0.149 and weighted average of 63.3%. Similarly, the statistical analysis conducted on geographies consisting of 285,625,723 people shows a slight positive correlation between the proportion of Nicaraguans and percentage of family households in the United States with a correlation coefficient (R) of 0.081 and weighted average of 67.4%, a difference of 6.4%.
Family Households Correlation Summary
| Measurement | Taiwanese | Nicaraguan |
| Minimum | 37.1% | 50.4% |
| Maximum | 84.9% | 100.0% |
| Range | 47.7% | 49.6% |
| Mean | 62.6% | 71.4% |
| Median | 64.3% | 71.5% |
| Interquartile 25% (IQ1) | 54.6% | 65.5% |
| Interquartile 75% (IQ3) | 71.6% | 76.3% |
| Interquartile Range (IQR) | 17.0% | 10.8% |
| Standard Deviation (Sample) | 11.8% | 11.0% |
| Standard Deviation (Population) | 11.7% | 10.9% |
Similar Demographics by Family Households
Demographics Similar to Taiwanese by Family Households
In terms of family households, the demographic groups most similar to Taiwanese are Bahamian (63.3%, a difference of 0.010%), Immigrants from Dominican Republic (63.3%, a difference of 0.040%), Slovak (63.3%, a difference of 0.040%), Immigrants from Japan (63.4%, a difference of 0.050%), and Russian (63.4%, a difference of 0.070%).
| Demographics | Rating | Rank | Family Households |
| Eastern Europeans | 1.6 /100 | #244 | Tragic 63.4% |
| Immigrants | Dominica | 1.6 /100 | #245 | Tragic 63.4% |
| Immigrants | Ghana | 1.6 /100 | #246 | Tragic 63.4% |
| Immigrants | Uzbekistan | 1.5 /100 | #247 | Tragic 63.4% |
| Dominicans | 1.5 /100 | #248 | Tragic 63.4% |
| Russians | 1.4 /100 | #249 | Tragic 63.4% |
| Immigrants | Japan | 1.4 /100 | #250 | Tragic 63.4% |
| Taiwanese | 1.2 /100 | #251 | Tragic 63.3% |
| Bahamians | 1.1 /100 | #252 | Tragic 63.3% |
| Immigrants | Dominican Republic | 1.0 /100 | #253 | Tragic 63.3% |
| Slovaks | 1.0 /100 | #254 | Tragic 63.3% |
| Potawatomi | 1.0 /100 | #255 | Tragic 63.3% |
| Luxembourgers | 0.9 /100 | #256 | Tragic 63.3% |
| Icelanders | 0.8 /100 | #257 | Tragic 63.3% |
| Immigrants | Barbados | 0.7 /100 | #258 | Tragic 63.2% |
Demographics Similar to Nicaraguans by Family Households
In terms of family households, the demographic groups most similar to Nicaraguans are Hawaiian (67.4%, a difference of 0.070%), Hispanic or Latino (67.4%, a difference of 0.080%), Immigrants from India (67.4%, a difference of 0.13%), Immigrants from Nicaragua (67.5%, a difference of 0.14%), and Immigrants from South Eastern Asia (67.5%, a difference of 0.16%).
| Demographics | Rating | Rank | Family Households |
| Sri Lankans | 100.0 /100 | #22 | Exceptional 67.7% |
| Immigrants | Pakistan | 100.0 /100 | #23 | Exceptional 67.7% |
| Immigrants | South Eastern Asia | 100.0 /100 | #24 | Exceptional 67.5% |
| Immigrants | Nicaragua | 100.0 /100 | #25 | Exceptional 67.5% |
| Immigrants | India | 100.0 /100 | #26 | Exceptional 67.4% |
| Hispanics or Latinos | 100.0 /100 | #27 | Exceptional 67.4% |
| Hawaiians | 100.0 /100 | #28 | Exceptional 67.4% |
| Nicaraguans | 100.0 /100 | #29 | Exceptional 67.4% |
| Immigrants | Peru | 100.0 /100 | #30 | Exceptional 67.2% |
| Immigrants | Latin America | 100.0 /100 | #31 | Exceptional 67.2% |
| Nepalese | 100.0 /100 | #32 | Exceptional 67.2% |
| Salvadorans | 100.0 /100 | #33 | Exceptional 67.2% |
| Thais | 100.0 /100 | #34 | Exceptional 67.2% |
| Tohono O'odham | 100.0 /100 | #35 | Exceptional 67.1% |
| Peruvians | 100.0 /100 | #36 | Exceptional 67.1% |