Taiwanese vs Northern European Cognitive Disability
COMPARE
Taiwanese
Northern European
Cognitive Disability
Cognitive Disability Comparison
Taiwanese
Northern Europeans
17.6%
COGNITIVE DISABILITY
7.7/ 100
METRIC RATING
211th/ 347
METRIC RANK
16.8%
COGNITIVE DISABILITY
97.8/ 100
METRIC RATING
106th/ 347
METRIC RANK
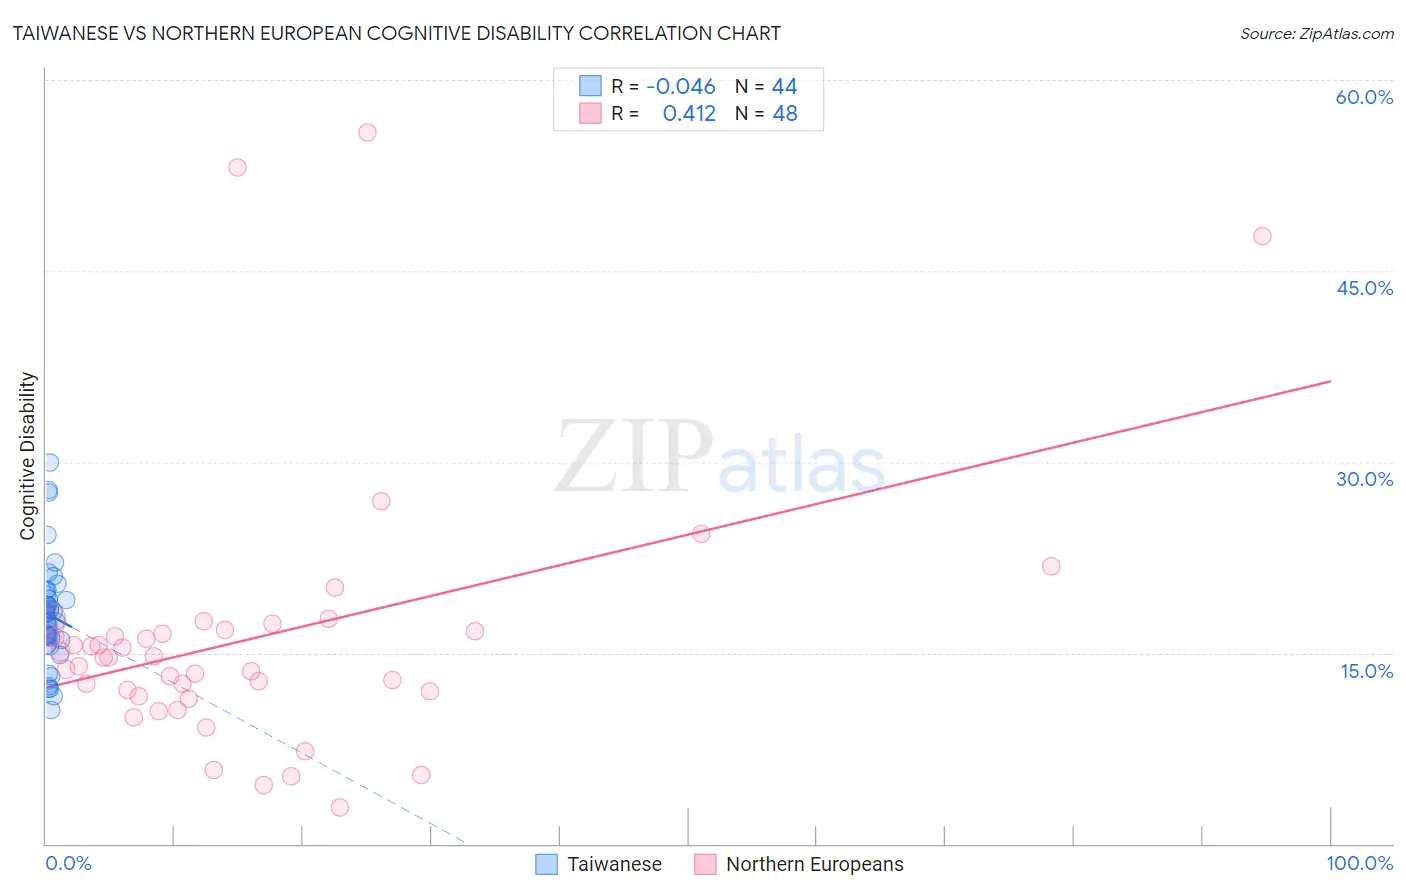
Taiwanese vs Northern European Cognitive Disability Correlation Chart
The statistical analysis conducted on geographies consisting of 31,724,936 people shows no correlation between the proportion of Taiwanese and percentage of population with cognitive disability in the United States with a correlation coefficient (R) of -0.046 and weighted average of 17.6%. Similarly, the statistical analysis conducted on geographies consisting of 406,047,149 people shows a moderate positive correlation between the proportion of Northern Europeans and percentage of population with cognitive disability in the United States with a correlation coefficient (R) of 0.412 and weighted average of 16.8%, a difference of 4.6%.
Cognitive Disability Correlation Summary
| Measurement | Taiwanese | Northern European |
| Minimum | 10.5% | 2.8% |
| Maximum | 30.0% | 55.9% |
| Range | 19.5% | 53.1% |
| Mean | 17.9% | 16.2% |
| Median | 17.8% | 14.7% |
| Interquartile 25% (IQ1) | 16.1% | 11.8% |
| Interquartile 75% (IQ3) | 19.4% | 16.7% |
| Interquartile Range (IQR) | 3.3% | 4.9% |
| Standard Deviation (Sample) | 4.1% | 10.6% |
| Standard Deviation (Population) | 4.0% | 10.4% |
Similar Demographics by Cognitive Disability
Demographics Similar to Taiwanese by Cognitive Disability
In terms of cognitive disability, the demographic groups most similar to Taiwanese are Immigrants from Oceania (17.6%, a difference of 0.040%), Hawaiian (17.6%, a difference of 0.050%), Immigrants from Jamaica (17.6%, a difference of 0.070%), Immigrants from El Salvador (17.6%, a difference of 0.080%), and Immigrants from Trinidad and Tobago (17.6%, a difference of 0.090%).
| Demographics | Rating | Rank | Cognitive Disability |
| Immigrants | Zimbabwe | 11.0 /100 | #204 | Poor 17.5% |
| Puget Sound Salish | 10.9 /100 | #205 | Poor 17.5% |
| Alaska Natives | 10.4 /100 | #206 | Poor 17.5% |
| Immigrants | Latin America | 9.7 /100 | #207 | Tragic 17.6% |
| Immigrants | Cameroon | 9.3 /100 | #208 | Tragic 17.6% |
| Immigrants | Trinidad and Tobago | 8.7 /100 | #209 | Tragic 17.6% |
| Immigrants | Jamaica | 8.5 /100 | #210 | Tragic 17.6% |
| Taiwanese | 7.7 /100 | #211 | Tragic 17.6% |
| Immigrants | Oceania | 7.3 /100 | #212 | Tragic 17.6% |
| Hawaiians | 7.2 /100 | #213 | Tragic 17.6% |
| Immigrants | El Salvador | 7.0 /100 | #214 | Tragic 17.6% |
| Alaskan Athabascans | 6.9 /100 | #215 | Tragic 17.6% |
| Okinawans | 6.8 /100 | #216 | Tragic 17.6% |
| Salvadorans | 6.7 /100 | #217 | Tragic 17.6% |
| Icelanders | 6.4 /100 | #218 | Tragic 17.6% |
Demographics Similar to Northern Europeans by Cognitive Disability
In terms of cognitive disability, the demographic groups most similar to Northern Europeans are Immigrants from Nicaragua (16.8%, a difference of 0.020%), Immigrants from Eastern Asia (16.8%, a difference of 0.040%), Paraguayan (16.8%, a difference of 0.050%), Palestinian (16.8%, a difference of 0.050%), and Irish (16.8%, a difference of 0.090%).
| Demographics | Rating | Rank | Cognitive Disability |
| Jordanians | 98.2 /100 | #99 | Exceptional 16.8% |
| Immigrants | Russia | 98.2 /100 | #100 | Exceptional 16.8% |
| Immigrants | Asia | 98.1 /100 | #101 | Exceptional 16.8% |
| Irish | 98.1 /100 | #102 | Exceptional 16.8% |
| Paraguayans | 98.0 /100 | #103 | Exceptional 16.8% |
| Palestinians | 98.0 /100 | #104 | Exceptional 16.8% |
| Immigrants | Eastern Asia | 97.9 /100 | #105 | Exceptional 16.8% |
| Northern Europeans | 97.8 /100 | #106 | Exceptional 16.8% |
| Immigrants | Nicaragua | 97.8 /100 | #107 | Exceptional 16.8% |
| Canadians | 97.5 /100 | #108 | Exceptional 16.8% |
| Albanians | 97.3 /100 | #109 | Exceptional 16.8% |
| Arapaho | 97.3 /100 | #110 | Exceptional 16.8% |
| Uruguayans | 97.2 /100 | #111 | Exceptional 16.8% |
| Indians (Asian) | 97.2 /100 | #112 | Exceptional 16.8% |
| Immigrants | Sri Lanka | 97.1 /100 | #113 | Exceptional 16.8% |