Taiwanese vs Immigrants from Laos Family Households
COMPARE
Taiwanese
Immigrants from Laos
Family Households
Family Households Comparison
Taiwanese
Immigrants from Laos
63.3%
FAMILY HOUSEHOLDS
1.2/ 100
METRIC RATING
251st/ 347
METRIC RANK
65.3%
FAMILY HOUSEHOLDS
99.1/ 100
METRIC RATING
90th/ 347
METRIC RANK
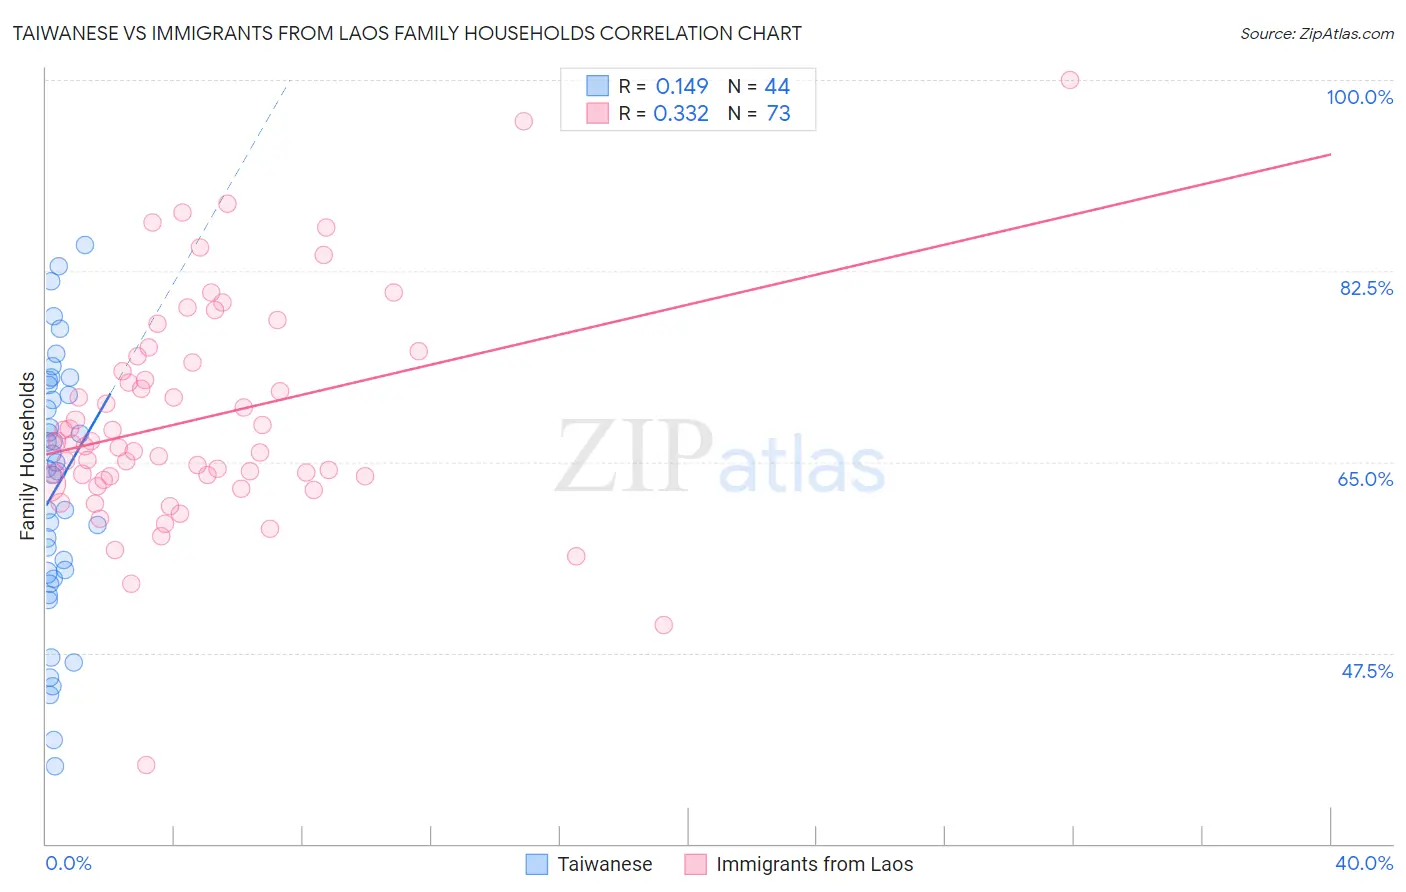
Taiwanese vs Immigrants from Laos Family Households Correlation Chart
The statistical analysis conducted on geographies consisting of 31,715,954 people shows a poor positive correlation between the proportion of Taiwanese and percentage of family households in the United States with a correlation coefficient (R) of 0.149 and weighted average of 63.3%. Similarly, the statistical analysis conducted on geographies consisting of 201,468,256 people shows a mild positive correlation between the proportion of Immigrants from Laos and percentage of family households in the United States with a correlation coefficient (R) of 0.332 and weighted average of 65.3%, a difference of 3.1%.
Family Households Correlation Summary
| Measurement | Taiwanese | Immigrants from Laos |
| Minimum | 37.1% | 37.2% |
| Maximum | 84.9% | 100.0% |
| Range | 47.7% | 62.8% |
| Mean | 62.6% | 69.0% |
| Median | 64.3% | 66.7% |
| Interquartile 25% (IQ1) | 54.6% | 63.5% |
| Interquartile 75% (IQ3) | 71.6% | 74.4% |
| Interquartile Range (IQR) | 17.0% | 10.9% |
| Standard Deviation (Sample) | 11.8% | 10.3% |
| Standard Deviation (Population) | 11.7% | 10.2% |
Similar Demographics by Family Households
Demographics Similar to Taiwanese by Family Households
In terms of family households, the demographic groups most similar to Taiwanese are Bahamian (63.3%, a difference of 0.010%), Immigrants from Dominican Republic (63.3%, a difference of 0.040%), Slovak (63.3%, a difference of 0.040%), Immigrants from Japan (63.4%, a difference of 0.050%), and Russian (63.4%, a difference of 0.070%).
| Demographics | Rating | Rank | Family Households |
| Eastern Europeans | 1.6 /100 | #244 | Tragic 63.4% |
| Immigrants | Dominica | 1.6 /100 | #245 | Tragic 63.4% |
| Immigrants | Ghana | 1.6 /100 | #246 | Tragic 63.4% |
| Immigrants | Uzbekistan | 1.5 /100 | #247 | Tragic 63.4% |
| Dominicans | 1.5 /100 | #248 | Tragic 63.4% |
| Russians | 1.4 /100 | #249 | Tragic 63.4% |
| Immigrants | Japan | 1.4 /100 | #250 | Tragic 63.4% |
| Taiwanese | 1.2 /100 | #251 | Tragic 63.3% |
| Bahamians | 1.1 /100 | #252 | Tragic 63.3% |
| Immigrants | Dominican Republic | 1.0 /100 | #253 | Tragic 63.3% |
| Slovaks | 1.0 /100 | #254 | Tragic 63.3% |
| Potawatomi | 1.0 /100 | #255 | Tragic 63.3% |
| Luxembourgers | 0.9 /100 | #256 | Tragic 63.3% |
| Icelanders | 0.8 /100 | #257 | Tragic 63.3% |
| Immigrants | Barbados | 0.7 /100 | #258 | Tragic 63.2% |
Demographics Similar to Immigrants from Laos by Family Households
In terms of family households, the demographic groups most similar to Immigrants from Laos are Immigrants from Caribbean (65.3%, a difference of 0.010%), Immigrants from Haiti (65.3%, a difference of 0.020%), Immigrants from Egypt (65.3%, a difference of 0.050%), Crow (65.3%, a difference of 0.050%), and Hopi (65.3%, a difference of 0.090%).
| Demographics | Rating | Rank | Family Households |
| Immigrants | Guyana | 99.6 /100 | #83 | Exceptional 65.5% |
| Americans | 99.6 /100 | #84 | Exceptional 65.5% |
| Immigrants | Cambodia | 99.5 /100 | #85 | Exceptional 65.4% |
| Egyptians | 99.4 /100 | #86 | Exceptional 65.4% |
| Immigrants | Egypt | 99.2 /100 | #87 | Exceptional 65.3% |
| Immigrants | Haiti | 99.1 /100 | #88 | Exceptional 65.3% |
| Immigrants | Caribbean | 99.1 /100 | #89 | Exceptional 65.3% |
| Immigrants | Laos | 99.1 /100 | #90 | Exceptional 65.3% |
| Crow | 98.9 /100 | #91 | Exceptional 65.3% |
| Hopi | 98.8 /100 | #92 | Exceptional 65.3% |
| Guyanese | 98.8 /100 | #93 | Exceptional 65.3% |
| Immigrants | Poland | 98.7 /100 | #94 | Exceptional 65.2% |
| Immigrants | Portugal | 98.6 /100 | #95 | Exceptional 65.2% |
| Swiss | 98.6 /100 | #96 | Exceptional 65.2% |
| Guatemalans | 98.6 /100 | #97 | Exceptional 65.2% |