Cape Verdean vs Northern European Family Households
COMPARE
Cape Verdean
Northern European
Family Households
Family Households Comparison
Cape Verdeans
Northern Europeans
61.8%
FAMILY HOUSEHOLDS
0.0/ 100
METRIC RATING
319th/ 347
METRIC RANK
64.1%
FAMILY HOUSEHOLDS
28.2/ 100
METRIC RATING
187th/ 347
METRIC RANK
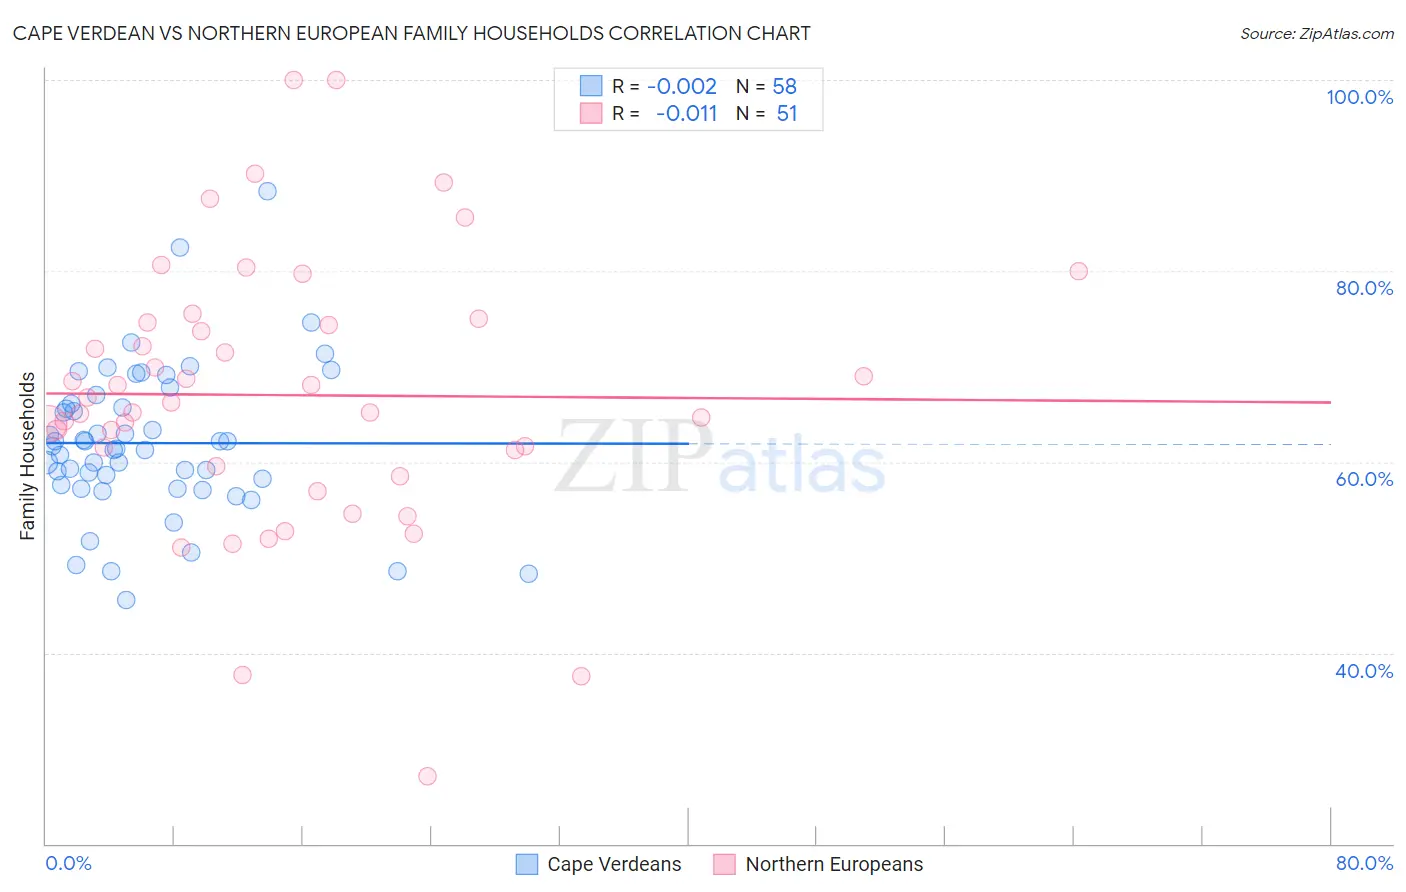
Cape Verdean vs Northern European Family Households Correlation Chart
The statistical analysis conducted on geographies consisting of 107,550,283 people shows no correlation between the proportion of Cape Verdeans and percentage of family households in the United States with a correlation coefficient (R) of -0.002 and weighted average of 61.8%. Similarly, the statistical analysis conducted on geographies consisting of 405,947,196 people shows no correlation between the proportion of Northern Europeans and percentage of family households in the United States with a correlation coefficient (R) of -0.011 and weighted average of 64.1%, a difference of 3.7%.
Family Households Correlation Summary
| Measurement | Cape Verdean | Northern European |
| Minimum | 45.5% | 27.1% |
| Maximum | 88.4% | 100.0% |
| Range | 42.9% | 72.9% |
| Mean | 62.0% | 67.0% |
| Median | 61.5% | 66.2% |
| Interquartile 25% (IQ1) | 57.5% | 59.5% |
| Interquartile 75% (IQ3) | 66.1% | 74.7% |
| Interquartile Range (IQR) | 8.6% | 15.1% |
| Standard Deviation (Sample) | 7.9% | 14.3% |
| Standard Deviation (Population) | 7.8% | 14.2% |
Similar Demographics by Family Households
Demographics Similar to Cape Verdeans by Family Households
In terms of family households, the demographic groups most similar to Cape Verdeans are Alaskan Athabascan (61.8%, a difference of 0.060%), Ugandan (61.7%, a difference of 0.12%), Immigrants from Bosnia and Herzegovina (61.9%, a difference of 0.14%), Alsatian (61.7%, a difference of 0.17%), and Immigrants from Middle Africa (61.9%, a difference of 0.18%).
| Demographics | Rating | Rank | Family Households |
| Immigrants | Latvia | 0.0 /100 | #312 | Tragic 62.0% |
| Liberians | 0.0 /100 | #313 | Tragic 62.0% |
| Immigrants | Cabo Verde | 0.0 /100 | #314 | Tragic 61.9% |
| Moroccans | 0.0 /100 | #315 | Tragic 61.9% |
| Immigrants | Middle Africa | 0.0 /100 | #316 | Tragic 61.9% |
| Immigrants | Bosnia and Herzegovina | 0.0 /100 | #317 | Tragic 61.9% |
| Alaskan Athabascans | 0.0 /100 | #318 | Tragic 61.8% |
| Cape Verdeans | 0.0 /100 | #319 | Tragic 61.8% |
| Ugandans | 0.0 /100 | #320 | Tragic 61.7% |
| Alsatians | 0.0 /100 | #321 | Tragic 61.7% |
| Immigrants | Serbia | 0.0 /100 | #322 | Tragic 61.6% |
| Tlingit-Haida | 0.0 /100 | #323 | Tragic 61.6% |
| Immigrants | West Indies | 0.0 /100 | #324 | Tragic 61.6% |
| Immigrants | Switzerland | 0.0 /100 | #325 | Tragic 61.6% |
| Indonesians | 0.0 /100 | #326 | Tragic 61.5% |
Demographics Similar to Northern Europeans by Family Households
In terms of family households, the demographic groups most similar to Northern Europeans are Spanish American (64.1%, a difference of 0.030%), Paraguayan (64.1%, a difference of 0.030%), Immigrants from Iran (64.1%, a difference of 0.040%), Immigrants from Western Asia (64.1%, a difference of 0.050%), and Zimbabwean (64.1%, a difference of 0.060%).
| Demographics | Rating | Rank | Family Households |
| Immigrants | Honduras | 35.0 /100 | #180 | Fair 64.2% |
| Immigrants | Trinidad and Tobago | 34.9 /100 | #181 | Fair 64.2% |
| Ukrainians | 34.6 /100 | #182 | Fair 64.2% |
| Creek | 34.1 /100 | #183 | Fair 64.2% |
| Puerto Ricans | 33.4 /100 | #184 | Fair 64.2% |
| Immigrants | Iran | 30.4 /100 | #185 | Fair 64.1% |
| Spanish Americans | 30.1 /100 | #186 | Fair 64.1% |
| Northern Europeans | 28.2 /100 | #187 | Fair 64.1% |
| Paraguayans | 26.7 /100 | #188 | Fair 64.1% |
| Immigrants | Western Asia | 25.3 /100 | #189 | Fair 64.1% |
| Zimbabweans | 24.7 /100 | #190 | Fair 64.1% |
| Arabs | 24.5 /100 | #191 | Fair 64.1% |
| Lithuanians | 23.8 /100 | #192 | Fair 64.0% |
| French | 23.7 /100 | #193 | Fair 64.0% |
| Paiute | 22.2 /100 | #194 | Fair 64.0% |