Taiwanese vs Immigrants from Europe Average Family Size
COMPARE
Taiwanese
Immigrants from Europe
Average Family Size
Average Family Size Comparison
Taiwanese
Immigrants from Europe
3.23
AVERAGE FAMILY SIZE
54.2/ 100
METRIC RATING
168th/ 347
METRIC RANK
3.15
AVERAGE FAMILY SIZE
0.5/ 100
METRIC RATING
279th/ 347
METRIC RANK
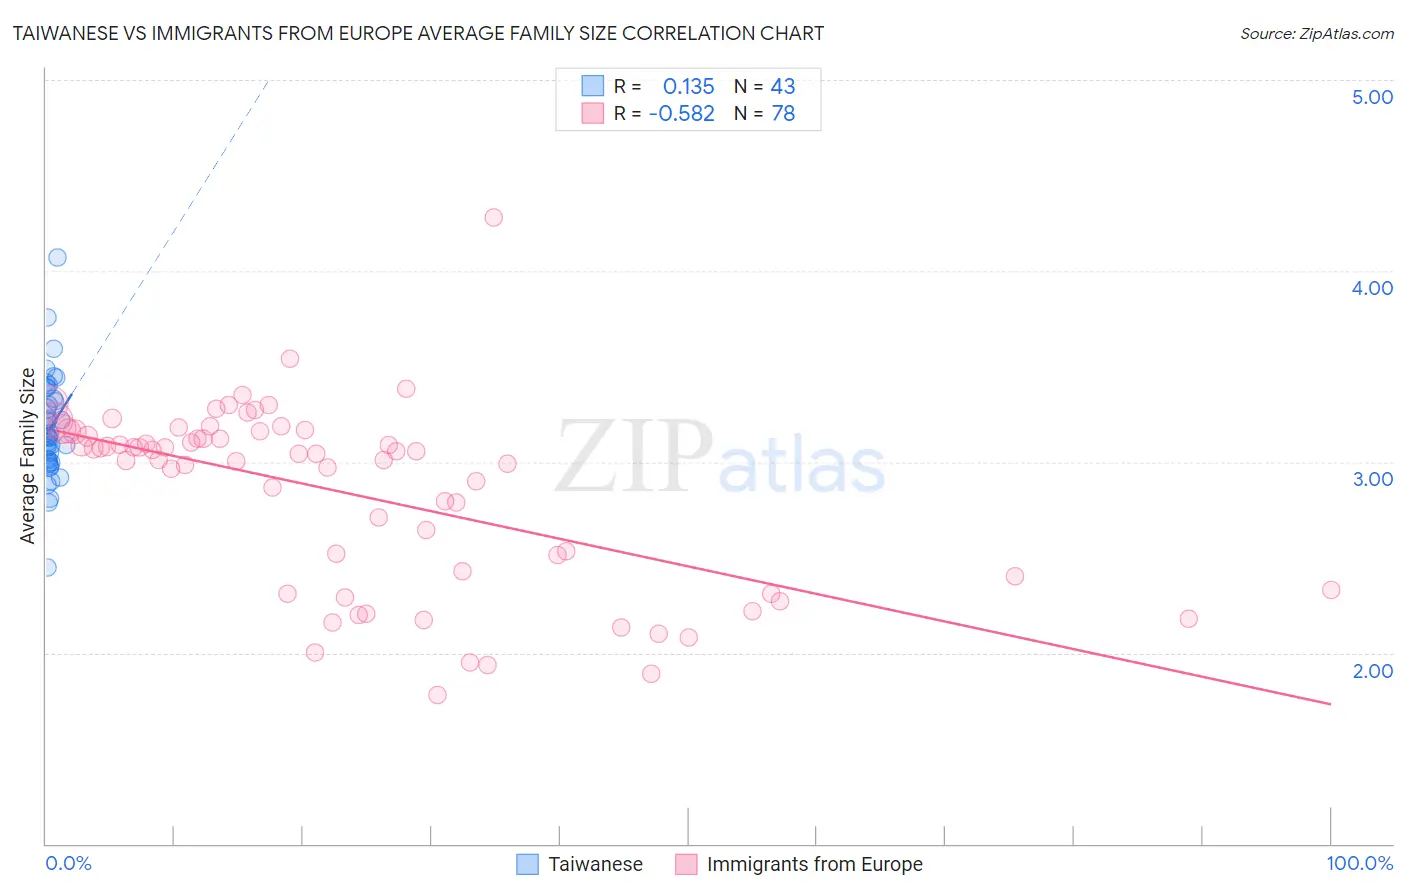
Taiwanese vs Immigrants from Europe Average Family Size Correlation Chart
The statistical analysis conducted on geographies consisting of 31,668,405 people shows a poor positive correlation between the proportion of Taiwanese and average family size in the United States with a correlation coefficient (R) of 0.135 and weighted average of 3.23. Similarly, the statistical analysis conducted on geographies consisting of 546,902,968 people shows a substantial negative correlation between the proportion of Immigrants from Europe and average family size in the United States with a correlation coefficient (R) of -0.582 and weighted average of 3.15, a difference of 2.6%.
Average Family Size Correlation Summary
| Measurement | Taiwanese | Immigrants from Europe |
| Minimum | 2.45 | 1.78 |
| Maximum | 4.07 | 4.28 |
| Range | 1.62 | 2.50 |
| Mean | 3.18 | 2.84 |
| Median | 3.13 | 3.04 |
| Interquartile 25% (IQ1) | 3.00 | 2.40 |
| Interquartile 75% (IQ3) | 3.33 | 3.16 |
| Interquartile Range (IQR) | 0.33 | 0.76 |
| Standard Deviation (Sample) | 0.27 | 0.48 |
| Standard Deviation (Population) | 0.27 | 0.47 |
Similar Demographics by Average Family Size
Demographics Similar to Taiwanese by Average Family Size
In terms of average family size, the demographic groups most similar to Taiwanese are Aleut (3.23, a difference of 0.0%), Arab (3.23, a difference of 0.010%), Chilean (3.23, a difference of 0.020%), Immigrants from Congo (3.23, a difference of 0.030%), and Immigrants from Uruguay (3.23, a difference of 0.040%).
| Demographics | Rating | Rank | Average Family Size |
| Immigrants | Chile | 63.2 /100 | #161 | Good 3.24 |
| Immigrants | Uganda | 60.1 /100 | #162 | Good 3.23 |
| Uruguayans | 58.8 /100 | #163 | Average 3.23 |
| Egyptians | 58.6 /100 | #164 | Average 3.23 |
| Ugandans | 58.4 /100 | #165 | Average 3.23 |
| Immigrants | Senegal | 57.5 /100 | #166 | Average 3.23 |
| Dutch West Indians | 56.9 /100 | #167 | Average 3.23 |
| Taiwanese | 54.2 /100 | #168 | Average 3.23 |
| Aleuts | 54.1 /100 | #169 | Average 3.23 |
| Arabs | 53.8 /100 | #170 | Average 3.23 |
| Chileans | 53.2 /100 | #171 | Average 3.23 |
| Immigrants | Congo | 52.7 /100 | #172 | Average 3.23 |
| Immigrants | Uruguay | 52.0 /100 | #173 | Average 3.23 |
| Immigrants | South Central Asia | 50.0 /100 | #174 | Average 3.23 |
| Immigrants | China | 49.9 /100 | #175 | Average 3.23 |
Demographics Similar to Immigrants from Europe by Average Family Size
In terms of average family size, the demographic groups most similar to Immigrants from Europe are Okinawan (3.15, a difference of 0.020%), Immigrants from England (3.15, a difference of 0.030%), Swiss (3.15, a difference of 0.040%), Immigrants from Bosnia and Herzegovina (3.15, a difference of 0.060%), and Immigrants from Denmark (3.15, a difference of 0.060%).
| Demographics | Rating | Rank | Average Family Size |
| Immigrants | Lithuania | 0.6 /100 | #272 | Tragic 3.15 |
| New Zealanders | 0.6 /100 | #273 | Tragic 3.15 |
| Immigrants | Belgium | 0.6 /100 | #274 | Tragic 3.15 |
| Cambodians | 0.6 /100 | #275 | Tragic 3.15 |
| Immigrants | Bosnia and Herzegovina | 0.5 /100 | #276 | Tragic 3.15 |
| Swiss | 0.5 /100 | #277 | Tragic 3.15 |
| Okinawans | 0.5 /100 | #278 | Tragic 3.15 |
| Immigrants | Europe | 0.5 /100 | #279 | Tragic 3.15 |
| Immigrants | England | 0.4 /100 | #280 | Tragic 3.15 |
| Immigrants | Denmark | 0.4 /100 | #281 | Tragic 3.15 |
| Yugoslavians | 0.4 /100 | #282 | Tragic 3.15 |
| German Russians | 0.4 /100 | #283 | Tragic 3.15 |
| Immigrants | France | 0.4 /100 | #284 | Tragic 3.15 |
| Whites/Caucasians | 0.3 /100 | #285 | Tragic 3.14 |
| Immigrants | Netherlands | 0.3 /100 | #286 | Tragic 3.14 |