Taiwanese vs Immigrants from Laos Unemployment Among Seniors over 65 years
COMPARE
Taiwanese
Immigrants from Laos
Unemployment Among Seniors over 65 years
Unemployment Among Seniors over 65 years Comparison
Taiwanese
Immigrants from Laos
6.0%
UNEMPLOYMENT AMONG SENIORS OVER 65 YEARS
0.0/ 100
METRIC RATING
331st/ 347
METRIC RANK
5.1%
UNEMPLOYMENT AMONG SENIORS OVER 65 YEARS
63.8/ 100
METRIC RATING
166th/ 347
METRIC RANK
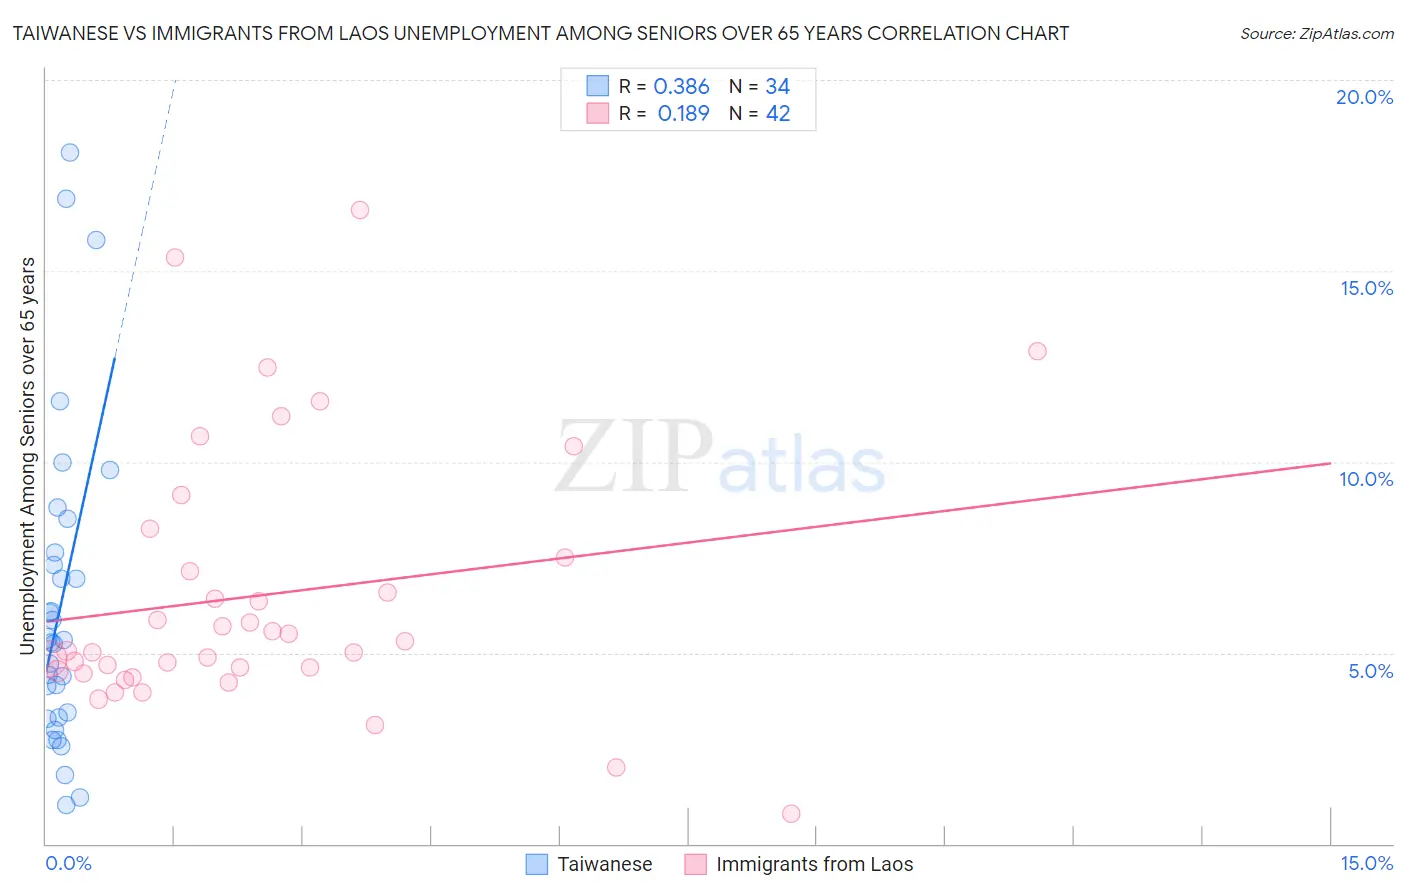
Taiwanese vs Immigrants from Laos Unemployment Among Seniors over 65 years Correlation Chart
The statistical analysis conducted on geographies consisting of 31,497,797 people shows a mild positive correlation between the proportion of Taiwanese and unemployment rate amomg seniors over the age of 65 in the United States with a correlation coefficient (R) of 0.386 and weighted average of 6.0%. Similarly, the statistical analysis conducted on geographies consisting of 188,048,022 people shows a poor positive correlation between the proportion of Immigrants from Laos and unemployment rate amomg seniors over the age of 65 in the United States with a correlation coefficient (R) of 0.189 and weighted average of 5.1%, a difference of 16.6%.
Unemployment Among Seniors over 65 years Correlation Summary
| Measurement | Taiwanese | Immigrants from Laos |
| Minimum | 1.0% | 0.80% |
| Maximum | 18.1% | 16.6% |
| Range | 17.1% | 15.8% |
| Mean | 6.3% | 6.5% |
| Median | 5.3% | 5.2% |
| Interquartile 25% (IQ1) | 3.3% | 4.5% |
| Interquartile 75% (IQ3) | 7.6% | 7.5% |
| Interquartile Range (IQR) | 4.3% | 3.0% |
| Standard Deviation (Sample) | 4.2% | 3.5% |
| Standard Deviation (Population) | 4.1% | 3.4% |
Similar Demographics by Unemployment Among Seniors over 65 years
Demographics Similar to Taiwanese by Unemployment Among Seniors over 65 years
In terms of unemployment among seniors over 65 years, the demographic groups most similar to Taiwanese are Aleut (6.0%, a difference of 0.050%), Immigrants from Portugal (6.0%, a difference of 0.15%), Dominican (6.0%, a difference of 0.17%), Immigrants from Dominican Republic (6.0%, a difference of 0.60%), and Puerto Rican (5.9%, a difference of 0.92%).
| Demographics | Rating | Rank | Unemployment Among Seniors over 65 years |
| Yuman | 0.0 /100 | #324 | Tragic 5.8% |
| Inupiat | 0.0 /100 | #325 | Tragic 5.8% |
| Shoshone | 0.0 /100 | #326 | Tragic 5.9% |
| Bermudans | 0.0 /100 | #327 | Tragic 5.9% |
| Puerto Ricans | 0.0 /100 | #328 | Tragic 5.9% |
| Dominicans | 0.0 /100 | #329 | Tragic 6.0% |
| Immigrants | Portugal | 0.0 /100 | #330 | Tragic 6.0% |
| Taiwanese | 0.0 /100 | #331 | Tragic 6.0% |
| Aleuts | 0.0 /100 | #332 | Tragic 6.0% |
| Immigrants | Dominican Republic | 0.0 /100 | #333 | Tragic 6.0% |
| Tohono O'odham | 0.0 /100 | #334 | Tragic 6.1% |
| Immigrants | Armenia | 0.0 /100 | #335 | Tragic 6.2% |
| Pima | 0.0 /100 | #336 | Tragic 6.3% |
| Alaska Natives | 0.0 /100 | #337 | Tragic 6.3% |
| Immigrants | Azores | 0.0 /100 | #338 | Tragic 6.3% |
Demographics Similar to Immigrants from Laos by Unemployment Among Seniors over 65 years
In terms of unemployment among seniors over 65 years, the demographic groups most similar to Immigrants from Laos are Immigrants from Ukraine (5.1%, a difference of 0.010%), Potawatomi (5.1%, a difference of 0.020%), Nepalese (5.1%, a difference of 0.020%), Immigrants from South Eastern Asia (5.1%, a difference of 0.060%), and Immigrants from Bosnia and Herzegovina (5.1%, a difference of 0.080%).
| Demographics | Rating | Rank | Unemployment Among Seniors over 65 years |
| Immigrants | France | 68.6 /100 | #159 | Good 5.1% |
| French | 68.1 /100 | #160 | Good 5.1% |
| Immigrants | Bosnia and Herzegovina | 66.1 /100 | #161 | Good 5.1% |
| Immigrants | South Eastern Asia | 65.6 /100 | #162 | Good 5.1% |
| Potawatomi | 64.5 /100 | #163 | Good 5.1% |
| Nepalese | 64.5 /100 | #164 | Good 5.1% |
| Immigrants | Ukraine | 64.2 /100 | #165 | Good 5.1% |
| Immigrants | Laos | 63.8 /100 | #166 | Good 5.1% |
| Immigrants | Western Europe | 60.4 /100 | #167 | Good 5.1% |
| Mongolians | 59.8 /100 | #168 | Average 5.1% |
| Lithuanians | 58.2 /100 | #169 | Average 5.1% |
| Immigrants | Eastern Asia | 54.9 /100 | #170 | Average 5.1% |
| Immigrants | Nonimmigrants | 54.1 /100 | #171 | Average 5.1% |
| Immigrants | Ireland | 53.2 /100 | #172 | Average 5.1% |
| Immigrants | Spain | 51.7 /100 | #173 | Average 5.1% |