Korean vs Immigrants from Laos Family Households
COMPARE
Korean
Immigrants from Laos
Family Households
Family Households Comparison
Koreans
Immigrants from Laos
68.3%
FAMILY HOUSEHOLDS
100.0/ 100
METRIC RATING
12th/ 347
METRIC RANK
65.3%
FAMILY HOUSEHOLDS
99.1/ 100
METRIC RATING
90th/ 347
METRIC RANK
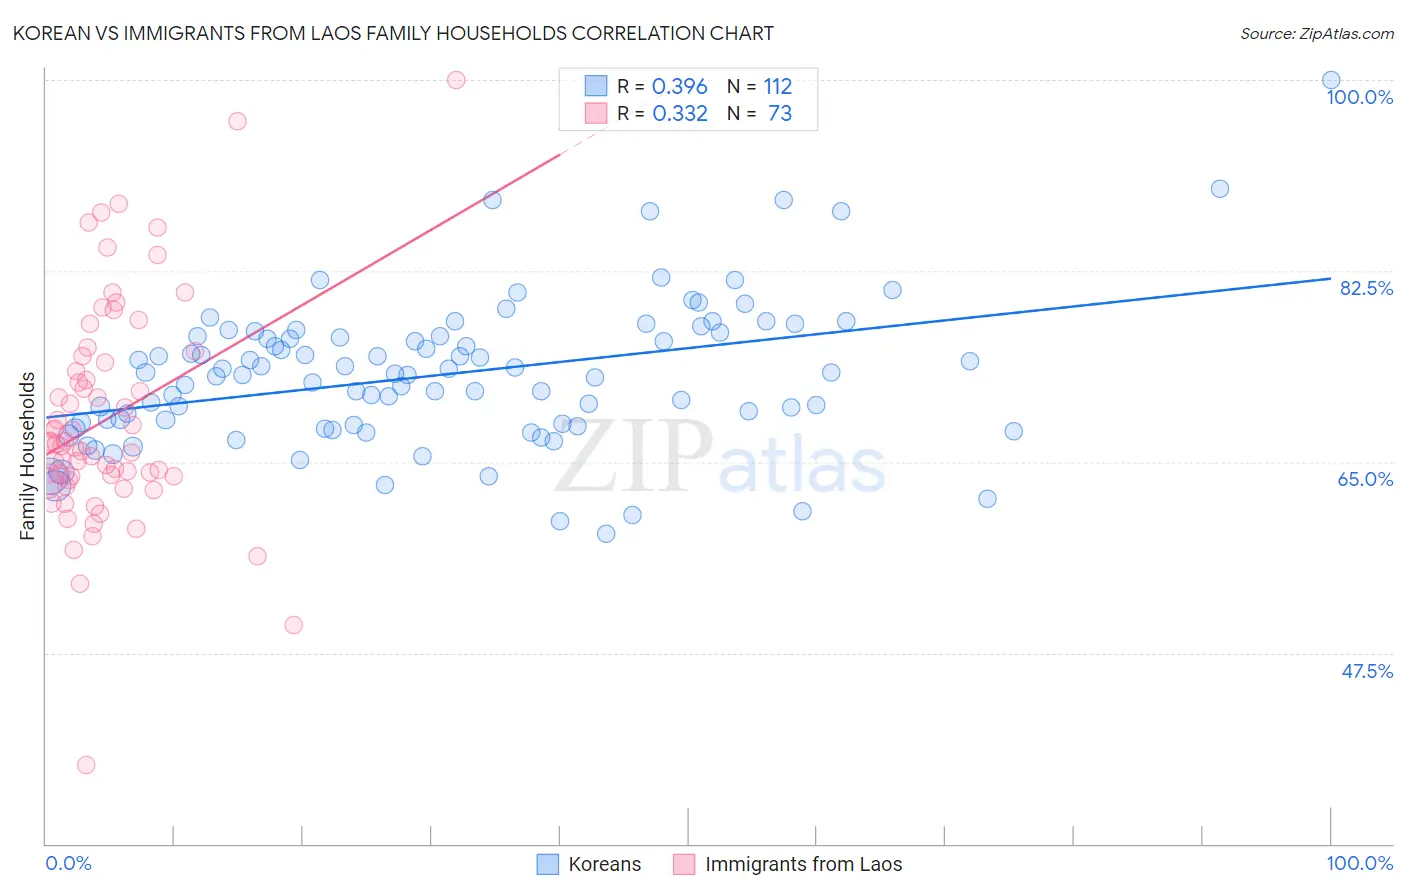
Korean vs Immigrants from Laos Family Households Correlation Chart
The statistical analysis conducted on geographies consisting of 510,403,530 people shows a mild positive correlation between the proportion of Koreans and percentage of family households in the United States with a correlation coefficient (R) of 0.396 and weighted average of 68.3%. Similarly, the statistical analysis conducted on geographies consisting of 201,468,256 people shows a mild positive correlation between the proportion of Immigrants from Laos and percentage of family households in the United States with a correlation coefficient (R) of 0.332 and weighted average of 65.3%, a difference of 4.5%.
Family Households Correlation Summary
| Measurement | Korean | Immigrants from Laos |
| Minimum | 58.5% | 37.2% |
| Maximum | 100.0% | 100.0% |
| Range | 41.5% | 62.8% |
| Mean | 73.0% | 69.0% |
| Median | 73.1% | 66.7% |
| Interquartile 25% (IQ1) | 68.4% | 63.5% |
| Interquartile 75% (IQ3) | 76.5% | 74.4% |
| Interquartile Range (IQR) | 8.1% | 10.9% |
| Standard Deviation (Sample) | 6.7% | 10.3% |
| Standard Deviation (Population) | 6.7% | 10.2% |
Similar Demographics by Family Households
Demographics Similar to Koreans by Family Households
In terms of family households, the demographic groups most similar to Koreans are Immigrants from Central America (68.3%, a difference of 0.030%), Pueblo (68.2%, a difference of 0.080%), Immigrants from Cuba (68.2%, a difference of 0.090%), Immigrants from Philippines (68.3%, a difference of 0.10%), and Assyrian/Chaldean/Syriac (68.2%, a difference of 0.15%).
| Demographics | Rating | Rank | Family Households |
| Yuman | 100.0 /100 | #5 | Exceptional 69.3% |
| Immigrants | Mexico | 100.0 /100 | #6 | Exceptional 69.1% |
| Mexicans | 100.0 /100 | #7 | Exceptional 69.0% |
| Immigrants | Fiji | 100.0 /100 | #8 | Exceptional 68.8% |
| Native Hawaiians | 100.0 /100 | #9 | Exceptional 68.4% |
| Immigrants | Philippines | 100.0 /100 | #10 | Exceptional 68.3% |
| Immigrants | Central America | 100.0 /100 | #11 | Exceptional 68.3% |
| Koreans | 100.0 /100 | #12 | Exceptional 68.3% |
| Pueblo | 100.0 /100 | #13 | Exceptional 68.2% |
| Immigrants | Cuba | 100.0 /100 | #14 | Exceptional 68.2% |
| Assyrians/Chaldeans/Syriacs | 100.0 /100 | #15 | Exceptional 68.2% |
| Immigrants | Vietnam | 100.0 /100 | #16 | Exceptional 68.2% |
| Chinese | 100.0 /100 | #17 | Exceptional 68.1% |
| Immigrants | Taiwan | 100.0 /100 | #18 | Exceptional 68.0% |
| Samoans | 100.0 /100 | #19 | Exceptional 67.9% |
Demographics Similar to Immigrants from Laos by Family Households
In terms of family households, the demographic groups most similar to Immigrants from Laos are Immigrants from Caribbean (65.3%, a difference of 0.010%), Immigrants from Haiti (65.3%, a difference of 0.020%), Immigrants from Egypt (65.3%, a difference of 0.050%), Crow (65.3%, a difference of 0.050%), and Hopi (65.3%, a difference of 0.090%).
| Demographics | Rating | Rank | Family Households |
| Immigrants | Guyana | 99.6 /100 | #83 | Exceptional 65.5% |
| Americans | 99.6 /100 | #84 | Exceptional 65.5% |
| Immigrants | Cambodia | 99.5 /100 | #85 | Exceptional 65.4% |
| Egyptians | 99.4 /100 | #86 | Exceptional 65.4% |
| Immigrants | Egypt | 99.2 /100 | #87 | Exceptional 65.3% |
| Immigrants | Haiti | 99.1 /100 | #88 | Exceptional 65.3% |
| Immigrants | Caribbean | 99.1 /100 | #89 | Exceptional 65.3% |
| Immigrants | Laos | 99.1 /100 | #90 | Exceptional 65.3% |
| Crow | 98.9 /100 | #91 | Exceptional 65.3% |
| Hopi | 98.8 /100 | #92 | Exceptional 65.3% |
| Guyanese | 98.8 /100 | #93 | Exceptional 65.3% |
| Immigrants | Poland | 98.7 /100 | #94 | Exceptional 65.2% |
| Immigrants | Portugal | 98.6 /100 | #95 | Exceptional 65.2% |
| Swiss | 98.6 /100 | #96 | Exceptional 65.2% |
| Guatemalans | 98.6 /100 | #97 | Exceptional 65.2% |