French vs Immigrants from Guatemala Average Family Size
COMPARE
French
Immigrants from Guatemala
Average Family Size
Average Family Size Comparison
French
Immigrants from Guatemala
3.10
AVERAGE FAMILY SIZE
0.0/ 100
METRIC RATING
338th/ 347
METRIC RANK
3.41
AVERAGE FAMILY SIZE
100.0/ 100
METRIC RATING
32nd/ 347
METRIC RANK
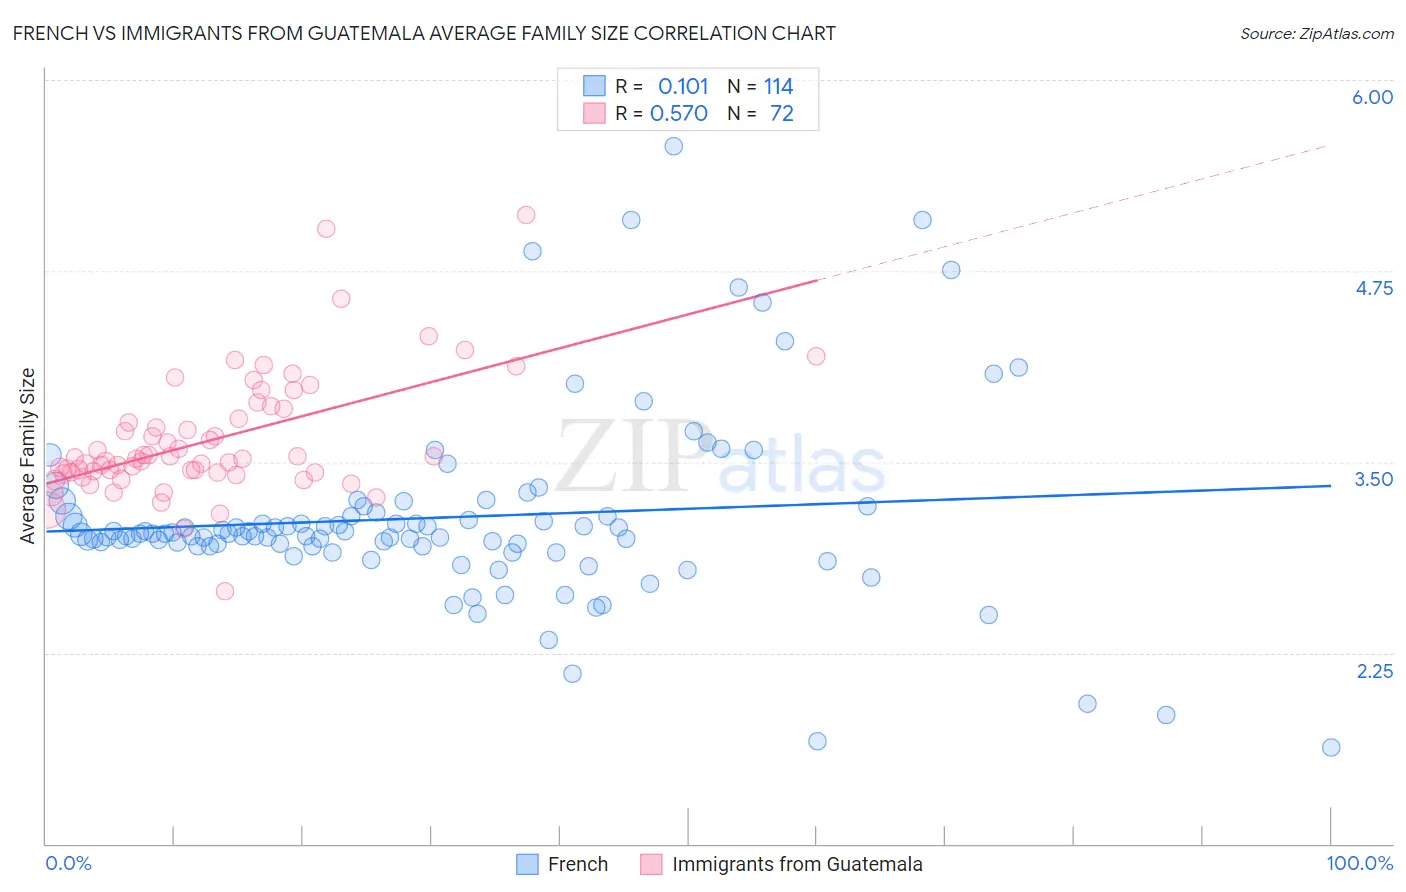
French vs Immigrants from Guatemala Average Family Size Correlation Chart
The statistical analysis conducted on geographies consisting of 571,815,188 people shows a poor positive correlation between the proportion of French and average family size in the United States with a correlation coefficient (R) of 0.101 and weighted average of 3.10. Similarly, the statistical analysis conducted on geographies consisting of 377,174,912 people shows a substantial positive correlation between the proportion of Immigrants from Guatemala and average family size in the United States with a correlation coefficient (R) of 0.570 and weighted average of 3.41, a difference of 10.0%.
Average Family Size Correlation Summary
| Measurement | French | Immigrants from Guatemala |
| Minimum | 1.63 | 2.65 |
| Maximum | 5.57 | 5.12 |
| Range | 3.94 | 2.47 |
| Mean | 3.14 | 3.64 |
| Median | 3.03 | 3.52 |
| Interquartile 25% (IQ1) | 2.95 | 3.43 |
| Interquartile 75% (IQ3) | 3.17 | 3.82 |
| Interquartile Range (IQR) | 0.22 | 0.39 |
| Standard Deviation (Sample) | 0.62 | 0.40 |
| Standard Deviation (Population) | 0.62 | 0.40 |
Similar Demographics by Average Family Size
Demographics Similar to French by Average Family Size
In terms of average family size, the demographic groups most similar to French are Croatian (3.10, a difference of 0.010%), Swedish (3.10, a difference of 0.020%), Irish (3.10, a difference of 0.060%), Luxembourger (3.10, a difference of 0.12%), and Estonian (3.10, a difference of 0.15%).
| Demographics | Rating | Rank | Average Family Size |
| Scotch-Irish | 0.0 /100 | #331 | Tragic 3.11 |
| Scottish | 0.0 /100 | #332 | Tragic 3.11 |
| Estonians | 0.0 /100 | #333 | Tragic 3.10 |
| Lithuanians | 0.0 /100 | #334 | Tragic 3.10 |
| Luxembourgers | 0.0 /100 | #335 | Tragic 3.10 |
| Irish | 0.0 /100 | #336 | Tragic 3.10 |
| Swedes | 0.0 /100 | #337 | Tragic 3.10 |
| French | 0.0 /100 | #338 | Tragic 3.10 |
| Croatians | 0.0 /100 | #339 | Tragic 3.10 |
| Finns | 0.0 /100 | #340 | Tragic 3.09 |
| Poles | 0.0 /100 | #341 | Tragic 3.09 |
| Germans | 0.0 /100 | #342 | Tragic 3.09 |
| Norwegians | 0.0 /100 | #343 | Tragic 3.08 |
| French Canadians | 0.0 /100 | #344 | Tragic 3.07 |
| Slovenes | 0.0 /100 | #345 | Tragic 3.07 |
Demographics Similar to Immigrants from Guatemala by Average Family Size
In terms of average family size, the demographic groups most similar to Immigrants from Guatemala are Hawaiian (3.41, a difference of 0.030%), Hispanic or Latino (3.41, a difference of 0.080%), Central American (3.41, a difference of 0.10%), Guatemalan (3.40, a difference of 0.14%), and Immigrants from Guyana (3.40, a difference of 0.19%).
| Demographics | Rating | Rank | Average Family Size |
| Yakama | 100.0 /100 | #25 | Exceptional 3.45 |
| Native Hawaiians | 100.0 /100 | #26 | Exceptional 3.43 |
| Mexican American Indians | 100.0 /100 | #27 | Exceptional 3.43 |
| Immigrants | Latin America | 100.0 /100 | #28 | Exceptional 3.42 |
| Nepalese | 100.0 /100 | #29 | Exceptional 3.42 |
| Samoans | 100.0 /100 | #30 | Exceptional 3.42 |
| Central Americans | 100.0 /100 | #31 | Exceptional 3.41 |
| Immigrants | Guatemala | 100.0 /100 | #32 | Exceptional 3.41 |
| Hawaiians | 100.0 /100 | #33 | Exceptional 3.41 |
| Hispanics or Latinos | 100.0 /100 | #34 | Exceptional 3.41 |
| Guatemalans | 100.0 /100 | #35 | Exceptional 3.40 |
| Immigrants | Guyana | 100.0 /100 | #36 | Exceptional 3.40 |
| Guyanese | 100.0 /100 | #37 | Exceptional 3.40 |
| Immigrants | Belize | 100.0 /100 | #38 | Exceptional 3.39 |
| Immigrants | Haiti | 100.0 /100 | #39 | Exceptional 3.39 |