Immigrants from Spain vs Immigrants from Micronesia Divorced or Separated
COMPARE
Immigrants from Spain
Immigrants from Micronesia
Divorced or Separated
Divorced or Separated Comparison
Immigrants from Spain
Immigrants from Micronesia
11.7%
DIVORCED OR SEPARATED
96.8/ 100
METRIC RATING
111th/ 347
METRIC RANK
12.7%
DIVORCED OR SEPARATED
0.3/ 100
METRIC RATING
273rd/ 347
METRIC RANK
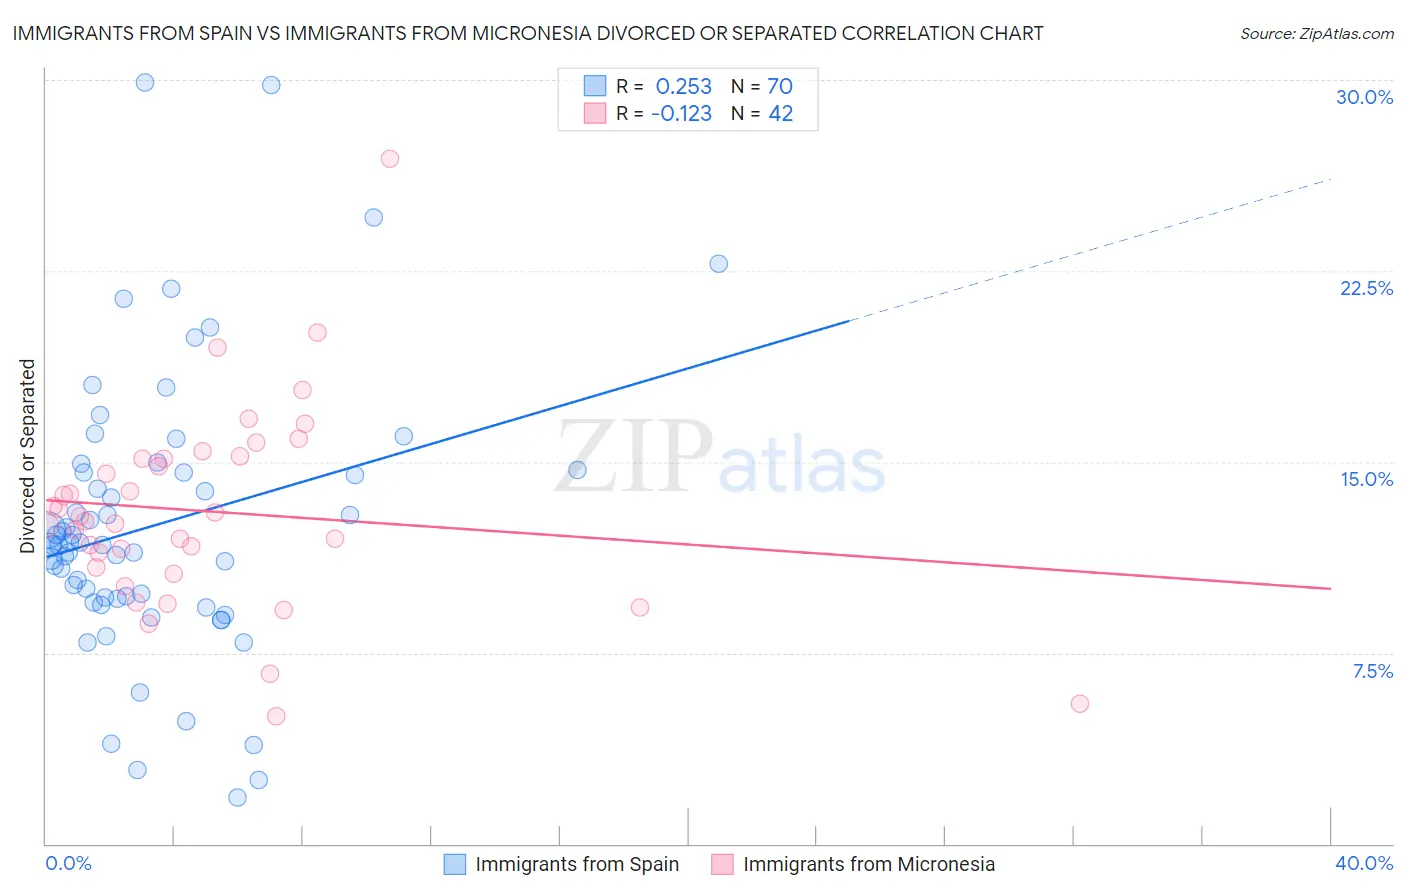
Immigrants from Spain vs Immigrants from Micronesia Divorced or Separated Correlation Chart
The statistical analysis conducted on geographies consisting of 239,591,348 people shows a weak positive correlation between the proportion of Immigrants from Spain and percentage of population currently divorced or separated in the United States with a correlation coefficient (R) of 0.253 and weighted average of 11.7%. Similarly, the statistical analysis conducted on geographies consisting of 61,605,566 people shows a poor negative correlation between the proportion of Immigrants from Micronesia and percentage of population currently divorced or separated in the United States with a correlation coefficient (R) of -0.123 and weighted average of 12.7%, a difference of 8.3%.
Divorced or Separated Correlation Summary
| Measurement | Immigrants from Spain | Immigrants from Micronesia |
| Minimum | 1.8% | 5.0% |
| Maximum | 29.9% | 26.9% |
| Range | 28.1% | 21.9% |
| Mean | 12.5% | 13.1% |
| Median | 11.8% | 12.8% |
| Interquartile 25% (IQ1) | 9.6% | 10.8% |
| Interquartile 75% (IQ3) | 14.6% | 15.1% |
| Interquartile Range (IQR) | 5.0% | 4.3% |
| Standard Deviation (Sample) | 5.5% | 4.0% |
| Standard Deviation (Population) | 5.4% | 3.9% |
Similar Demographics by Divorced or Separated
Demographics Similar to Immigrants from Spain by Divorced or Separated
In terms of divorced or separated, the demographic groups most similar to Immigrants from Spain are Immigrants from South Africa (11.7%, a difference of 0.040%), Immigrants from Czechoslovakia (11.7%, a difference of 0.040%), Greek (11.7%, a difference of 0.050%), Immigrants from France (11.7%, a difference of 0.050%), and Estonian (11.7%, a difference of 0.050%).
| Demographics | Rating | Rank | Divorced or Separated |
| Salvadorans | 98.2 /100 | #104 | Exceptional 11.6% |
| Immigrants | El Salvador | 97.9 /100 | #105 | Exceptional 11.7% |
| Immigrants | Kazakhstan | 97.8 /100 | #106 | Exceptional 11.7% |
| Native Hawaiians | 97.2 /100 | #107 | Exceptional 11.7% |
| Greeks | 96.9 /100 | #108 | Exceptional 11.7% |
| Immigrants | South Africa | 96.9 /100 | #109 | Exceptional 11.7% |
| Immigrants | Czechoslovakia | 96.9 /100 | #110 | Exceptional 11.7% |
| Immigrants | Spain | 96.8 /100 | #111 | Exceptional 11.7% |
| Immigrants | France | 96.6 /100 | #112 | Exceptional 11.7% |
| Estonians | 96.6 /100 | #113 | Exceptional 11.7% |
| Immigrants | Norway | 95.9 /100 | #114 | Exceptional 11.7% |
| Lithuanians | 95.7 /100 | #115 | Exceptional 11.7% |
| Immigrants | Iraq | 95.4 /100 | #116 | Exceptional 11.7% |
| Immigrants | Uganda | 95.3 /100 | #117 | Exceptional 11.7% |
| Ecuadorians | 95.3 /100 | #118 | Exceptional 11.7% |
Demographics Similar to Immigrants from Micronesia by Divorced or Separated
In terms of divorced or separated, the demographic groups most similar to Immigrants from Micronesia are Bermudan (12.7%, a difference of 0.010%), Central American Indian (12.7%, a difference of 0.040%), Spaniard (12.7%, a difference of 0.10%), Immigrants from Middle Africa (12.7%, a difference of 0.12%), and Dominican (12.7%, a difference of 0.15%).
| Demographics | Rating | Rank | Divorced or Separated |
| Whites/Caucasians | 0.5 /100 | #266 | Tragic 12.6% |
| Scottish | 0.4 /100 | #267 | Tragic 12.6% |
| Fijians | 0.4 /100 | #268 | Tragic 12.6% |
| Immigrants | Liberia | 0.4 /100 | #269 | Tragic 12.6% |
| Ute | 0.4 /100 | #270 | Tragic 12.6% |
| Panamanians | 0.3 /100 | #271 | Tragic 12.7% |
| Immigrants | Middle Africa | 0.3 /100 | #272 | Tragic 12.7% |
| Immigrants | Micronesia | 0.3 /100 | #273 | Tragic 12.7% |
| Bermudans | 0.3 /100 | #274 | Tragic 12.7% |
| Central American Indians | 0.3 /100 | #275 | Tragic 12.7% |
| Spaniards | 0.2 /100 | #276 | Tragic 12.7% |
| Dominicans | 0.2 /100 | #277 | Tragic 12.7% |
| Lumbee | 0.2 /100 | #278 | Tragic 12.7% |
| Immigrants | Dominican Republic | 0.2 /100 | #279 | Tragic 12.7% |
| Immigrants | Zaire | 0.2 /100 | #280 | Tragic 12.7% |